
Page 264 - Fundamentals of Reservoir Engineering
P. 264
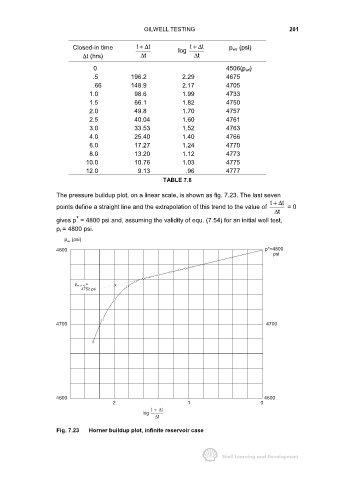
OILWELL TESTING                                    201


                           Closed-in time        t +∆ t         log   t +∆ t     p ws (psi)
                              ∆t (hrs)              t ∆               t ∆
                                  0                                             4506(p wf)
                                  .5           196.2             2.29           4675
                                  .66          148.9             2.17           4705
                                1.0             98.6             1.99           4733
                                1.5             66.1             1.82           4750
                                2.0             49.8             1.70           4757
                                2.5             40.04            1.60           4761
                                3.0             33.53            1.52           4763
                                4.0             25.40            1.40           4766
                                6.0             17.27            1.24           4770
                                8.0             13.20            1.12           4773
                               10.0             10.76            1.03           4775
                               12.0              9.13             .96           4777
                                                          TABLE 7.6

                     The pressure buildup plot, on a linear scale, is shown as fig. 7.23. The last seven
                                                                                                t +∆ t
                     points define a straight line and the extrapolation of this trend to the value of    = 0
                                                                                                   t ∆
                            *
                     gives p  = 4800 psi and, assuming the validity of equ. (7.54) for an initial well test,
                     p i = 4800 psi.

                        p (psi)
                         ws
                     4800                                                                     p*=4800
                                                                                                    psi


                               =
                            ws
                            p  (1 hr)    x
                                  4752 psi


                     4700                                                                     4700


                     4600                                                                     4600
                                         2                         1                        0
                                                      t  +∆t
                                                   log
                                                       ∆t

                     Fig. 7.23  Horner buildup plot, infinite reservoir case