Page 266 - Fundamentals of Reservoir Engineering
P. 266

OILWELL TESTING                                    203


                       Closed-in time         Closed-in         Closed-in time         Closed-in
                          ∆t (hrs)        pressure p ws (psi)      ∆t (hrs)        pressure p ws (psi)

                            0                 1889                  6                    2790
                            0.5               2683                  7.5                  2795
                            1                 2713                 10                    2804

                            1.5               2743                 12                    2809
                            2                 2752                 14                    2813

                            2.5               2760                 16                    2817
                            3                 2766                 20                    2823
                            3.5               2771                 25                    2833

                            4                 2777                 30                    2840
                            4.5               2779                 36                    2844

                            5                 2783
                                                          TABLE 7.7

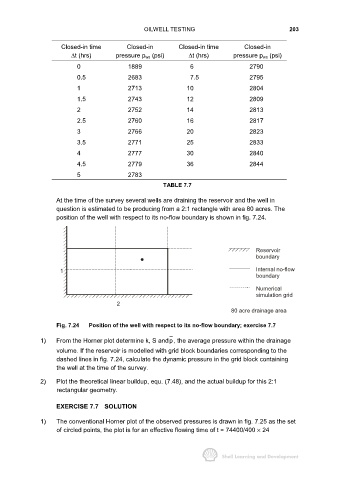
                     At the time of the survey several wells are draining the reservoir and the well in
                     question is estimated to be producing from a 2:1 rectangle with area 80 acres. The
                     position of the well with respect to its no-flow boundary is shown in fig. 7.24.


                                                                                           Reservoir
                                                                                           boundary

                      1                                                                    Internal no-flow
                                                                                           boundary
                                                                                           Numerical
                                                                                           simulation grid
                                          2
                                                                                  80 acre drainage area


                     Fig. 7.24  Position of the well with respect to its no-flow boundary; exercise 7.7

               1)    From the Horner plot determine k, S andp, the average pressure within the drainage
                     volume. If the reservoir is modelled with grid block boundaries corresponding to the
                     dashed lines in fig. 7.24, calculate the dynamic pressure in the grid block containing
                     the well at the time of the survey.

               2)    Plot the theoretical linear buildup, equ. (7.48), and the actual buildup for this 2:1
                     rectangular geometry.

                     EXERCISE 7.7 SOLUTION


               1)    The conventional Horner plot of the observed pressures is drawn in fig. 7.25 as the set
                     of circled points, the plot is for an effective flowing time of t = 74400/400 × 24
   261   262   263   264   265   266   267   268   269   270   271