
Page 270 - Fundamentals of Reservoir Engineering
P. 270
OILWELL TESTING 207
4A
p D () = ½ ln + 2 t DA (7.27)
t
π
D
γ Cr 2
Aw
and substituting this in equ. (7.48) reduces the latter to
t +∆ t
0.0144 (4800 p− ws(LIN) ) = 1.151 log + 2 t DA − ½ ln (C t )
π
A DA
t ∆ (7.66)
t +∆ t
= 1.151 log + α
t ∆
where α = 26.58 - ½ ln (C A 4.23)
To investigate the effect of the geometry of the drainage area and well asymmetry, α
and hence equ. (7.66), has been evaluated for the three markedly different cases
shown in table 7.8.
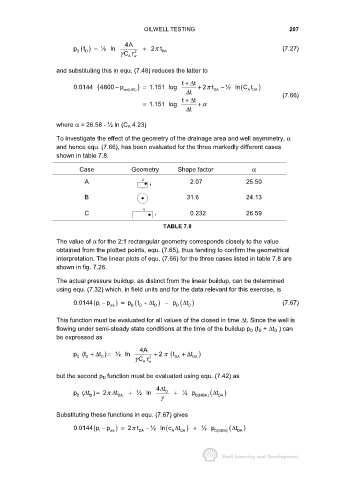
Case Geometry Shape factor α
A 2 2.07 25.50
1
B 31.6 24.13
4
C 1 0.232 26.59
TABLE 7.8
The value of α for the 2:1 rectangular geometry corresponds closely to the value
obtained from the plotted points, equ. (7.65), thus tending to confirm the geometrical
interpretation. The linear plots of equ. (7.66) for the three cases listed in table 7.8 are
shown in fig. 7.26.
The actual pressure buildup, as distinct from the linear buildup, can be determined
using equ. (7.32) which, in field units and for the data relevant for this exercise, is
0.0144 (p − p ws ) = p D ( D t D ) − p D ( t∆ D ) (7.67)
t + ∆
i
This function must be evaluated for all values of the closed in time ∆t. Since the well is
flowing under semi-steady state conditions at the time of the buildup p D (t D + ∆t D ) can
be expressed as
4A
t
p (t +∆ t ) = ½ ln 2 + 2 π ( DA + t ∆ DA )
D
D
D
γ Cr
Aw
but the second p D function must be evaluated using equ. (7.42) as
4t
∆
p ( t ) = 2π ∆ t DA + ½ ln D + ½ p D(MBH) ( t∆ DA )
∆
D
D
γ
Substituting these functions in equ. (7.67) gives
0.0144 (p − p ws ) = 2 t DA − ½ ln (c ∆ t DA ) + ½ p DMBH ) ( t∆ DA )
π
A
i
(