
Page 268 - Fundamentals of Reservoir Engineering
P. 268
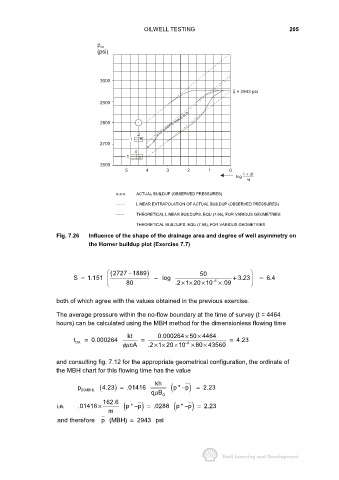
OILWELL TESTING 205
p ws
(psi)
3000
p = 2943 psi
2900
2800
2
1
2700
4
1
2600
5 4 3 2 1 0
log t +∆t
∆t
o-o-o ACTUAL BUILDUP (OBSERVED PRESSURES)
- - - - LINEAR EXTRAPOLATION OF ACTUAL BUILDUP (OBSERVED PRESSURES)
------ THEORETICAL LINEAR BUILDUPS, EQU (7.66), FOR VARIOUS GEOMETRIES
THEORETICAL BUILDUPS, EQU (7.68), FOR VARIOUS GEOMETRIES
Fig. 7.26 Influence of the shape of the drainage area and degree of well asymmetry on
the Horner buildup plot (Exercise 7.7)
(2727 1889− ) 50
S = 1.151 − log − 6 + 3.23 = 6.4
×
××
80 .2 1 20 10 × .09
both of which agree with the values obtained in the previous exercise.
The average pressure within the no-flow boundary at the time of survey (t = 4464
hours) can be calculated using the MBH method for the dimensionless flowing time
kt 0.000264 50 4464
×
×
t DA = 0.000264 = = 4.23
6
−
×
××
×
φµ cA .2 1 20 10 × 80 43560
and consulting fig. 7.12 for the appropriate geometrical configuration, the ordinate of
the MBH chart for this flowing time has the value
kh
p (4.23 = .01416 ( p * p ) = 2.23
)
−
D(MBH)
qB O
µ
162.6
)
)
i.e. .01416 × ( p * p = .0288 ( p * p = 2.23
−
−
m
and therefore p (MBH) = 2943 psi