
Page 330 - Fundamentals of Reservoir Engineering
P. 330
REAL GAS FLOW: GAS WELL TESTING 265
the correct value of the Darcy flow coefficient B. At first sight this analysis technique
appears to be rather useful but the following exercise will reveal the great sensitivity in
the plot to the chosen value of F.
EXERCISE 8.1 MULTI-RATE GAS WELL TEST ANALYSED ASSUMING
STABILIZED FLOW CONDITIONS
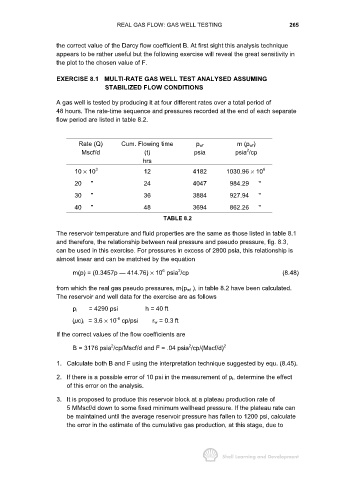
A gas well is tested by producing it at four different rates over a total period of
48 hours. The rate-time sequence and pressures recorded at the end of each separate
flow period are listed in table 8.2.
Rate (Q) Cum. Flowing time p wf m (p wf)
2
Mscf/d (t) psia psia /cp
hrs
10 × 10 3 12 4182 1030.96 × 10 6
20 " 24 4047 984.29 "
30 " 36 3884 927.94 "
40 " 48 3694 862.26 "
TABLE 8.2
The reservoir temperature and fluid properties are the same as those listed in table 8.1
and therefore, the relationship between real pressure and pseudo pressure, fig. 8.3,
can be used in this exercise. For pressures in excess of 2800 psia, this relationship is
almost linear and can be matched by the equation
6
2
m(p) = (0.3457p — 414.76) × 10 psia /cp (8.48)
from which the real gas pseudo pressures, m(p wf ), in table 8.2 have been calculated.
The reservoir and well data for the exercise are as follows
p i = 4290 psi h = 40 ft
-6
(µc) i = 3.6 × 10 cp/psi r w = 0.3 ft
If the correct values of the flow coefficients are
2
2
B = 3176 psia /cp/Mscf/d and F = .04 psia /cp/(Mscf/d) 2
1. Calculate both B and F using the interpretation technique suggested by equ. (8.45).
2. If there is a possible error of 10 psi in the measurement of p i, determine the effect
of this error on the analysis.
3. It is proposed to produce this reservoir block at a plateau production rate of
5 MMscf/d down to some fixed minimum wellhead pressure. If the plateau rate can
be maintained until the average reservoir pressure has fallen to 1200 psi, calculate
the error in the estimate of the cumulative gas production, at this stage, due to