
Page 331 - Fundamentals of Reservoir Engineering
P. 331
REAL GAS FLOW: GAS WELL TESTING 266
using the analysis results determined in the first part of this exercise, instead of the
correct values of B and F.
4. Using, as an initial estimate, the value of F determined in the first part of this
exercise, analyse the test data using the interpretation technique of equ. (8.47).
EXERCISE 8.1 SOLUTION
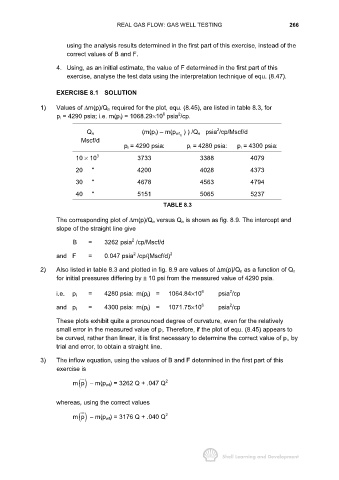
1) Values of ∆m(p)/Q n required for the plot, equ. (8.45), are listed in table 8.3, for
2
6
p i = 4290 psia; i.e. m(p i) = 1068.29×10 psia /cp.
2
Q n (m(p I) − m(p wf ) ) /Q n psia /cp/Mscf/d
n
Mscf/d
p i = 4290 psia: p i = 4280 psia: p i = 4300 psia:
10 × 10 3 3733 3388 4079
20 " 4200 4028 4373
30 " 4678 4563 4794
40 " 5151 5065 5237
TABLE 8.3
The corresponding plot of ∆m(p)/Q n versus Q n is shown as fig. 8.9. The intercept and
slope of the straight line give
2
B = 3262 psia /cp/Mscf/d
2
and F = 0.047 psia /cp/(Mscf/d) 2
2) Also listed in table 8.3 and plotted in fig. 8.9 are values of ∆m(p)/Q n as a function of Q n
for initial pressures differing by ± 10 psi from the measured value of 4290 psia.
2
i.e. p i = 4280 psia: m(p i) = 1064.84×10 6 psia /cp
2
and p i = 4300 psia: m(p i) = 1071.75×10 6 psia /cp
These plots exhibit quite a pronounced degree of curvature, even for the relatively
small error in the measured value of p i. Therefore, if the plot of equ. (8.45) appears to
be curved, rather than linear, it is first necessary to determine the correct value of p i, by
trial and error, to obtain a straight line.
3) The inflow equation, using the values of B and F determined in the first part of this
exercise is
m() p − m(p wf) = 3262 Q + .047 Q 2
whereas, using the correct values
m() p − m(p wf) = 3176 Q + .040 Q 2