
Page 337 - Fundamentals of Reservoir Engineering
P. 337
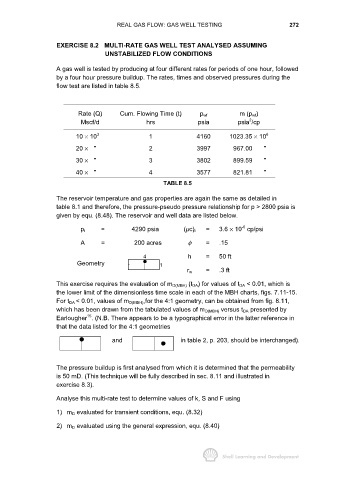
REAL GAS FLOW: GAS WELL TESTING                              272


                     EXERCISE 8.2 MULTI-RATE GAS WELL TEST ANALYSED ASSUMING
                                      UNSTABILIZED FLOW CONDITIONS

                     A gas well is tested by producing at four different rates for periods of one hour, followed
                     by a four hour pressure buildup. The rates, times and observed pressures during the
                     flow test are listed in table 8.5.


                            Rate (Q)       Cum. Flowing Time (t)       p wf          m (p wf)
                                                                                         2
                             Mscf/d                 hrs               psia           psia /cp
                            10 × 10 3                1                4160        1023.35 × 10 6

                            20 × "                   2                3997         967.00     "
                            30 × "                   3                3802         899.59     "

                            40 × "                   4                3577         821.81     "

                                                          TABLE 8.5

                     The reservoir temperature and gas properties are again the same as detailed in
                     table 8.1 and therefore, the pressure-pseudo pressure relationship for p > 2800 psia is
                     given by equ. (8.48). The reservoir and well data are listed below.

                                                                                      -6
                                     =         4290 psia                 =    3.6  × 10  cp/psi
                             p i                                  (µc) i
                             A       =           200 acres         φ     =    .15


                                                   4               h     =    50 ft
                            Geometry                     1
                                                                   r w   =    .3  ft
                     This exercise requires the evaluation of m D(MBH) (t DA) for values of t DA < 0.01, which is
                     the lower limit of the dimensionless time scale in each of the MBH charts, figs. 7.11-15.
                     For t DA < 0.01, values of m D(MBH),for the 4:1 geometry, can be obtained from fig. 8.11,
                     which has been drawn from the tabulated values of m D(MBH) versus t DA presented by
                                15
                     Earlougher . (N.B. There appears to be a typographical error in the latter reference in
                     that the data listed for the 4:1 geometries

                                        and                     in table 2, p. 203, should be interchanged).


                     The pressure buildup is first analysed from which it is determined that the permeability
                     is 50 mD. (This technique will be fully described in sec. 8.11 and illustrated in
                     exercise 8.3).
                     Analyse this multi-rate test to determine values of k, S and F using


                     1) m D evaluated for transient conditions, equ. (8.32)
                     2) m D evaluated using the general expression, equ. (8.40)