
Page 340 - Fundamentals of Water Treatment Unit Processes : Physical, Chemical, and Biological
P. 340
Flocculation 295
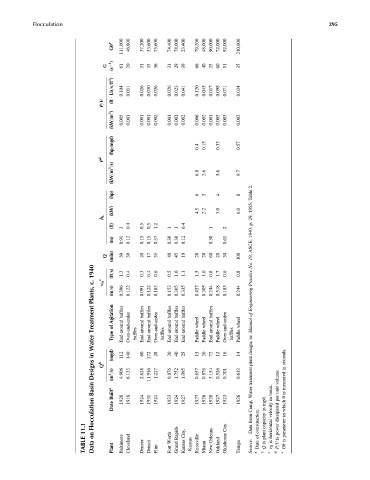
Gu e 111,000 46,800 37,200 33,600 75,600 74,400 78,000 23,400 79,200 48,000 90,000 72,000 92,000 210,000
G (s 1 ) 61 20 31 33 36 31 29 39 66 40 25 60 51 35
Lb=s=ft 3 ) 0.104 0.011 0.026 0.030 0.036 0.026 0.023 0.041 0.120 0.045 0.017 0.098 0.071 0.034
?
P=V (ft
(kW=m 3 ) 0.005 0.001 0.001 0.001 0.002 0.001 0.001 0.002 0.006 0.002 0.001 0.005 0.003 0.002
(hp=mgd) 0.4 0.15 0.33 0.57
P d
(kW=m 3 =s) 6.8 2.6 5.6 9.7
2.
(hp) 6 3 4 8 Table
(kW) 4.5 2.2 3.0 6.0 1955,
h L 29,
(ft) 3 0.4 0.5 0.5 1.2 1 1 0.4 1 2 p.
1940,
(m) 0.91 0.12 0.15 0.15 0.37 0.30 0.30 0.12 0.30 0.61 ASCE,
(min) 30 39 20 17 35 40 45 10 20 20 60 20 30 100
Q 19,
1940 (ft=s) 1.3 0.4 0.3 0.4 0.6 0.5 1.0 1.1 1.5 1.0 0.8 1.7 0.6 0.8 No.
c. v H c Practice
Plants, (m=s) 0.396 0.122 0.091 0.122 0.183 0.152 0.305 0.335 0.457 0.305 0.244 0.518 0.183 0.244 Engineering
Treatment Agitation of baffles End-around Over-and-under baffles End-around baffles End-around Over-and-under baffles End-around baffles End-around baffles End-around wheel wheel baffles End-around wheel Over-and-under wheel of Manual
Water Type baffles baffles Paddle Paddle Paddle baffles Paddle in: design,
in (mgd) 112 140 60 272 28 20 40 25 15 20 72 12 16 14 plant seconds.
Designs Q b (m 3 =s) 4.906 6.133 2.628 11.916 1.227 0.876 1.752 1.095 0.657 0.876 3.154 0.526 0.701 0.613 treatment volume. in
Basin Built a 1928 1918 1924 1931 1924 1923 1924 1927 1927 1926 1928 1927 1923 1926 Water mgd. basin. in unit per measured is u
Flocculation Date Camp, from construction. in capacity velocity dissipated which in
11.1 on Rapids City, Orleans City Data of plant horizontal power parameter
TABLE Data Plant Baltimore Cleveland Denver Detroit Flint Worth Fort Grand Kansas Kansas Knoxville Miami New Oakland Oklahoma Tampa Source: a Date b is Q c is v H d is P=V e is Gu