
Page 345 - Fundamentals of Water Treatment Unit Processes : Physical, Chemical, and Biological
P. 345
300 Fundamentals of Water Treatment Unit Processes: Physical, Chemical, and Biological
Kolmogorov microscale shown for reference. Figure 11.4b 11.4.2.1.2 Density
shows the floc size distributions for the same three alum The inner particle pore space in a fractal aggregate is consid-
dosages, all for G 63 s 1 (Spicer and Pratsinis, 1996a, ered to come from two sources: (1) the fractal nature, which is
p. 1051). With increasing G, the floc size distribution shifts related to the fundamental aggregation process, and (2)
to smaller diameters (Spicer and Pratsinis, 1996b). Relevant the packing effects, as related to the shapes of the primary
observations from the two plots are as follows: particles and the aggregates. Therefore, regarding the latter,
the ‘‘packing-factor,’’ z ¼ 1, which means that there is no pore
. The lowest alum dosage at 4.3 mg=L is for adsorption
space resulting from the shape effects of the aggregates. There
destabilization. The average floc size is lowest in this is still pore space, however, due to the fractal nature of the
1
zone, i.e., L(floc) avg 10 mmfor 63 G 129 s . aggregate, represented by the fractal parameter, D F (Lee et al.,
The associated floc size distribution, seen in Figure 2000, p. 1990).
11.4b, is narrowest for this zone. The buoyant density of a floc particle, as related to size, is
. For an medium alum dosage at 10.7 mg=L, the zone
(Reed and Mery, 1986, p. 75; Gregory 1989, p. 216) given by
is mixed. The average floc size is intermediate and is
affected moderately by G. The associated floc size a
r r ¼ kA (11:8)
distribution seen in Figure 11.4b is broader. f w
. For the highest alum dosage at 32 mg=L is for the
sweep-floc zone. The average floc size is highest where
3
in this zone and is affected strongly by G, i.e., r f is the mass density of floc (kg=m )
3
L(floc) avg , declines sharply as G increases. The asso- r w is the mass density of water (kg=m )
ciated floc size distribution seen in Figure 11.4b is k is the empirical coefficient, given as 0.349 for d(floc)
broadest for this zone. < 1.5 mm
2
. Also, since the smallest eddy size is approximately A is the projected area of floc (m )
a is the empirical exponent, given as 0.338 based on floc
thesameas l, i.e., Kolmogorov’s microscale, l* ¼
3
(n =e) 1=4 (see Equation 10.14), the shear field deter- geometry
mines the size characteristics of the resulting flocs at
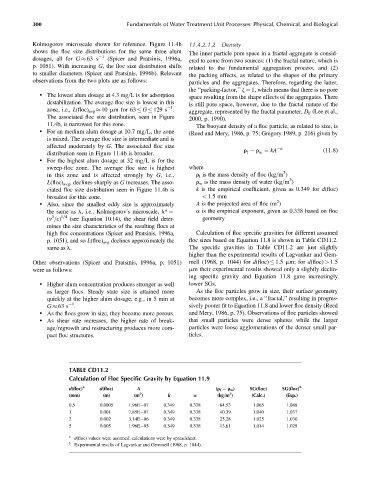
high floc concentrations (Spicer and Pratsinis, 1996a, Calculation of floc specific gravities for different assumed
p. 1051), and so L(floc) avg declines approximately the floc sizes based on Equation 11.8 is shown in Table CD11.2.
same as l. The specific gravities in Table CD11.2 are just slightly
higher than the experimental results of Lagvankar and Gem-
Other observations (Spicer and Pratsinis, 1996a, p. 1051) mell (1968, p. 1044) for d(floc) 1.5 mm; for d(floc) > 1.5
were as follows: mm their experimental results showed only a slightly declin-
ing specific gravity and Equation 11.8 gave increasingly
. Higher alum concentration produces stronger as well lower SGs.
as larger flocs. Steady state size is attained more As the floc particles grow in size, their surface geometry
quickly at the higher alum dosage, e.g., in 5 min at becomes more complex, i.e., a ‘‘fractal,’’ resulting in progres-
1
G 63 s . sively poorer fit to Equation 11.8 and lower floc density (Reed
. As the flocs grow in size, they become more porous. and Mery, 1986, p. 75). Observations of floc particles showed
. As shear rate increases, the higher rate of break- that small particles were dense spheres while the larger
age=regrowth and restructuring produces more com- particles were loose agglomerations of the denser small par-
pact floc structures. ticles.
TABLE CD11.2
Calculation of Floc Specific Gravity by Equation 11.9
d(floc) a d(floc) A (r f r w ) SG(floc) SG(floc) b
3
2
(mm) (m) (m ) k a (kg=m ) (Calc.) (Exp.)
0.5 0.0005 1.96E 07 0.349 0.338 64.53 1.065 1.048
1 0.001 7.85E 07 0.349 0.338 40.39 1.040 1.037
2 0.002 3.14E 06 0.349 0.338 25.28 1.025 1.030
5 0.005 1.96E 05 0.349 0.338 13.61 1.014 1.029
a
d(floc) values were assumed; calculations were by spreadsheet.
b
Experimental results of Lagvankar and Gemmell (1968, p. 1044).