
Page 344 - Fundamentals of Water Treatment Unit Processes : Physical, Chemical, and Biological
P. 344
Flocculation 299
11.4.1.1.7 Temperature Effect of size k particles by flocculation to become a larger size.
In one of the first studies of the influence of temperature on Equation 11.7 is a traditional relationship given by Ives
coagulation–flocculation settling, Leopold (1934, p. 1072) (1978, pp. 41, 47), Casson and Lawler (1990, p. 55), and
examined settling in laboratory jar tests after flocculation at Han and Lawler (1992, p. 80).
temperatures 2.28C, 7.28C, 12.88C, 18.38C, and 23.98C (368F,
458F, 558F, 658F, 758F) and found no difference. Hanson
11.4.2 NATURE OF FLOCS AND FLOCCULATION
and Cleasby (1990) confirmed this finding and cited others
who did as well, e.g., Velz (1934), Camp et al. (1940), The flocculation process starts with microflocs, which may
Morris and Knocke (1984), Cleasby (1984). These findings collide with primary particles, e.g., mineral turbidity, viruses,
are plausible if the conditions were turbulent as explained bacteria, protozoan cysts, etc., with a fraction being assimi-
by Cleasby (1984) and Hanson and Cleasby (1990). In quies- lated. The aggregates formed may, in turn, adhere to one
cent settling, in accordance with Stoke’s law, viscosity is a another upon subsequent collisions. How these flocs are
part of the mathematical relationship; thus temperature has formed and their characteristics are reviewed in this section.
an effect.
11.4.2.1 Characteristics of Flocs
The characteristics of flocs, the aggregation product of the
11.4.1.2 Rate of Formation of New Particles, k
flocculation process are important in the subsequent processes
An extension of Equation 11.1 is
of settling and filtration or flotation. Floc size, density, shape,
fractal appearance, age, shear resistance, settling velocity, and
1 X X
dn k shear resistance, are reviewed in this section.
g(i, j)n i n j n k g(i, k)n i (11:7)
¼
dt 2
iþj¼k all i
11.4.2.1.1 Size
where n k is the concentration of particles of size k (particles With regard to size, flocs are referred to often as ‘‘micro-
3
k=m ). flocs,’’ ‘‘pinpoint,’’ ‘‘intermediate,’’ and large. These sizes
The left side of Equation 11.7 is the rate of change of are, respectively, microfloc, <10 mm; pinpoint, 10–50 mm;
size k particles. The firstsummationontherightsideisthe intermediate, 50–100 mm; and large, >100 mm (p. 25).
rate at which k particles are formed due to collisions Within a floc basin, flocs of several mm, e.g., 0.5–3mm
between i and j particles. The relation under the summation may be seen (e.g., by a light beam) in the third basin, i.e.,
means that the sum of the i and j volumes equals the with the very slow paddle wheels. Within each size group, the
k volume. The factor 1=2 is applied so that the collisions distribution is usually ‘‘normal.’’
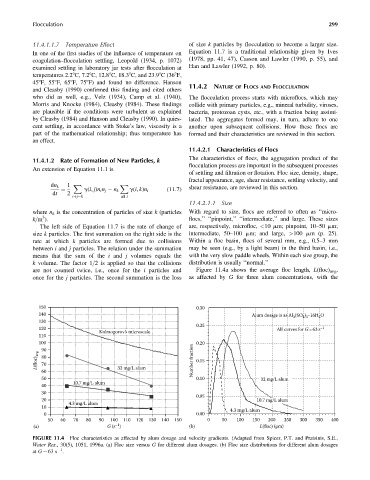
are not counted twice, i.e., once for the i particles and Figure 11.4a shows the average floc length, L(floc) avg ,
once for the j particles. The second summation is the loss as affected by G for three alum concentrations, with the
150 0.30
140 Alum dosage is as Al 2 (SO 4 ) 3 16H 2 O
•
130
0.25
120 All curves for G=63 s –1
Kolmogorov’s microscale
110
100 0.20
90
L(floc) avg 80 Number fraction 0.15
70
60 32 mg/L alum
50 0.10 32 mg/L alum
10.7 mg/L alum
40
30
0.05
20 10.7 mg/L alum
4.3 mg/L alum
10
4.3 mg/L alum
0 0.00
50 60 70 80 90 100 110 120 130 140 150 0 50 100 150 200 250 300 350 400
–1
(a) G (s ) (b) L(floc) (μm)
FIGURE 11.4 Floc characteristics as affected by alum dosage and velocity gradients. (Adapted from Spicer, P.T. and Pratsinis, S.E.,
Water Res., 30(5), 1051, 1996a. (a) Floc size versus G for different alum dosages. (b) Floc size distributions for different alum dosages
1
at G ¼ 63 s .