
Page 348 - Fundamentals of Water Treatment Unit Processes : Physical, Chemical, and Biological
P. 348
Flocculation 303
by a ‘‘gel-like’’ alum floc. For comparison, Bellouti et al. (1997, 1000 1000
p. 1230) found for anaerobic flocs, D F (avg) ¼ 1.84 (for meas-
urements of 54 particles).
11.4.2.1.7 Aging 100 100
Aging is the irreversible change of texture and floc structure Illite
from the moment flocs are completely formed (François, v(floc) (mm/s) Calcite
1987a, p. 523). Thus, the character of aluminum hydroxide Silt Montmorillonite
floc changes with time. Its solubility product is given with 10 10
respect to the reaction
Al(OH) 3 #þ H 2 O , Al(OH) 4 þ H þ
(11:10)
K(fresh) ¼ 1 10 13
1
0.001 0.01 0.1 1 10 100
14
After 12 days, K(aged)¼ 1.1 10 . During the continuing d(floc) (mm)
polymerization, the metal ions are linked with an increasing
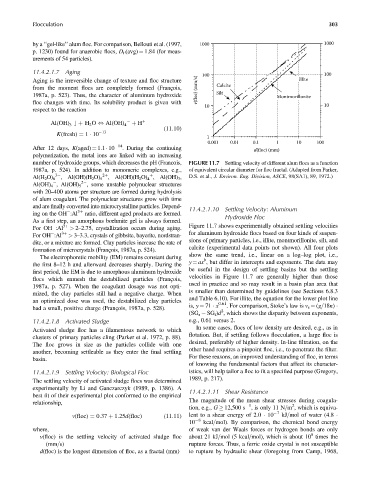
number of hydroxide groups, which decreases the pH (Francois, FIGURE 11.7 Settling velocity of different alum flocs as a function
1987a, p. 524). In addition to monomeric complexes, e.g., of equivalent circular diameter for floc fractal. (Adapted from Parker,
Al(H 2 O) 6 , Al(OH)(H 2 O) 5 , Al(OH)(H 2 O) 4 , Al(OH) 3 , D.S. et al., J. Environ. Eng. Division, ASCE, 98(SA1), 89, 1972.)
2þ
þ
3
Al(OH) 4 , Al(OH) 5 , some unstable polynuclear structures
2
with 20–400 atoms per structure are formed during hydrolysis
of alum coagulant. The polynuclear structures grow with time
and are finally converted into microcrystalline particles. Depend-
11.4.2.1.10 Settling Velocity: Aluminum
ingontheOH :Al 3þ ratio, different aged products are formed.
Hydroxide Floc
As a first step, an amorphous boehmite gel is always formed.
Figure 11.7 shows experimentally obtained settling velocities
For OH :Al 3þ > 2–2.75, crystallization occurs during aging.
for aluminum hydroxide flocs based on four kinds of suspen-
For OH :Al 3þ > 3–3.3, crystals of gibbsite, bayerite, nordstran-
sions of primary particles, i.e., illite, montmorillonite, silt, and
dite, or a mixture are formed. Clay particles increase the rate of
calcite (experimental data points not shown). All four plots
formation of microcrystals (François, 1987a, p. 524).
show the same trend, i.e., linear on a log–log plot, i.e.,
The electrophoretic mobility (EM) remains constant during b
y ¼ ax , but differ in intercepts and exponents. The data may
the first 8–12 h and afterward decreases sharply. During the
be useful in the design of settling basins but the settling
first period, the EM is due to amorphous aluminum hydroxide
velocities in Figure 11.7 are generally higher than those
flocs which enmesh the destabilized particles (François,
used in practice and so may result in a basin plan area that
1987a, p. 527). When the coagulant dosage was not opti-
is smaller than determined by guidelines (see Sections 6.8.3
mized, the clay particles still had a negative charge. When
and Table 6.10). For illite, the equation for the lower plot line
an optimized dose was used, the destabilized clay particles 0.61
is, y ¼ 71 x
had a small, positive charge (François, 1987a, p. 528). 2 . For comparison, Stoke’s law is v s ¼ (g=18n)
(SG s SG f )d , which shows the disparity between exponents,
11.4.2.1.8 Activated Sludge e.g., 0.61 versus 2.
In some cases, flocs of low density are desired, e.g., as in
Activated sludge floc has a filamentous network to which
flotation. But, if settling follows flocculation, a large floc is
clusters of primary particles cling (Parker et al. 1972, p. 88).
desired, preferably of higher density. In-line filtration, on the
The floc grows in size as the particles collide with one
other hand requires a pinpoint floc, i.e., to penetrate the filter.
another, becoming settleable as they enter the final settling
For these reasons, an improved understanding of floc, in terms
basin.
of knowing the fundamental factors that affect its character-
11.4.2.1.9 Settling Velocity: Biological Floc istics, will help tailor a floc to fit a specified purpose (Gregory,
1989, p. 217).
The settling velocity of activated sludge flocs was determined
experimentally by Li and Ganczarczyk (1989, p. 1386). A 11.4.2.1.11 Shear Resistance
best fit of their experimental plot conformed to the empirical
The magnitude of the mean shear stresses during coagula-
relationship, 1 2
tion, e.g., G 12,500 s , is only 11 N=m , which is equiva-
v(floc) ¼ 0:37 þ 1:25d(floc) (11:11) lent to a shear energy of 2.0 10 7 kJ=mol of water (4.8
10 8 kcal=mol). By comparison, the chemical bond energy
where, of weak van der Waals forces or hydrogen bonds are only
8
v(floc) is the settling velocity of activated sludge floc about 21 kJ=mol (5 kcal=mol), which is about 10 times the
(mm=s) rupture forces. Thus, a ferric oxide crystal is not susceptible
d(floc) is the longest dimension of floc, as a fractal (mm) to rupture by hydraulic shear (foregoing from Camp, 1968,