Page 418 - Fundamentals of Water Treatment Unit Processes : Physical, Chemical, and Biological
P. 418

Rapid Filtration                                                                                 373


                             0  2   4   6  8  10  12  14  16  18  20  22  24  26  28  30  32  34
                           18
                                                            Piezometers
                           16
                                                             HGL
                           14                                                            Δh = 4 units
                                                                       t = 0 h
                           12
                                  Headwater
                           10
                                                 A         B          C          D
                            8
                            6
                                                                                  Tail-
                                                              Mono media          water
                            4
                            2
                            0
                                                             ΔL=18 units


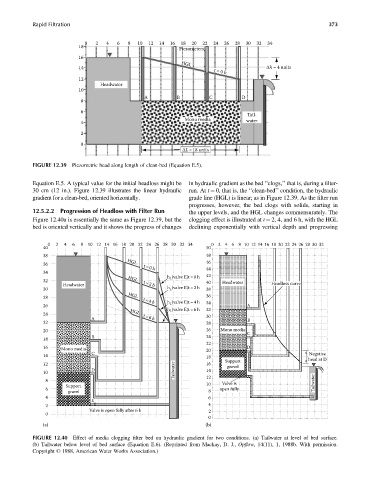
            FIGURE 12.39 Piezometric head along length of clean-bed (Equation E.5).

            Equation E.5. A typical value for the initial headloss might be  in hydraulic gradient as the bed ‘‘clogs,’’ that is, during a filter-
            30 cm (12 in.). Figure 12.39 illustrates the linear hydraulic  run. At t ¼ 0, that is, the ‘‘clean-bed’’ condition, the hydraulic
            gradient for a clean-bed, oriented horizontally.   grade line (HGL) is linear; as in Figure 12.39. As the filter run
                                                               progresses, however, the bed clogs with solids, starting in
            12.5.2.2  Progression of Headloss with Filter Run  the upper levels, and the HGL changes commensurately. The
            Figure 12.40a is essentially the same as Figure 12.39, but the  clogging effect is illustrated at t ¼ 2, 4, and 6 h, with the HGL
            bed is oriented vertically and it shows the progress of changes  declining exponentially with vertical depth and progressing


                 0  2  4  6  8  10 12 14 16 18 20 22 24 26 28 30 32 34  0 2 4 6 8 101214161820222426283032
               40                                                    50
               38                                                    48
                                           HGL                       46
               36
                                                t = 0 h
                                                                     44
               34
                                                        h L (valve E)t = 0 h  42
                                           HGL
               32                                                    40   Headwater
                      Headwater                 t=2 h                                     Headloss curve
               30                                       h L (valve E)t = 2 h  38
                                           HGL
               28                                                    36
                                                        h L (valve E)t = 4 h  34
                                                t=4 h
               26                                                                 A
                                                        h L (valve E)t = 6 h  32
                                            HGL
               24                                                    30
                               A                t = 6 h                           B
               22                                                    28
               20                                                    26   Mono media
                                                                                  C
                               B                                     24
               18
                                                                     22
               16    Mono media                                      20           D
                               C                                                                       Negative
               14                                                    18
                                                                           Support                    head at D
               12                                                    16     gravel
                               D                          Tailwater  14
               10                                                                 X
                8                                                    12   Valve is                      Tailwater
                       Support                                       10
                6                                                        open fully
                       gravel                                         8
                4                                                     6
                               E
                2               X                                     4
                              Valve is open fully after 6 h           2
                0
                                                                      0
               (a)                                                   (b)
            FIGURE 12.40 Effect of media clogging filter bed on hydraulic gradient for two conditions. (a) Tailwater at level of bed surface.
            (b) Tailwater below level of bed surface (Equation E.6). (Reprinted from Mackay, D. J., Opflow, 14(11), 1, 1988b. With permission.
            Copyright ß 1988, American Water Works Association.)
   413   414   415   416   417   418   419   420   421   422   423