
Page 413 - Fundamentals of Water Treatment Unit Processes : Physical, Chemical, and Biological
P. 413
368 Fundamentals of Water Treatment Unit Processes: Physical, Chemical, and Biological
in the protocol above, which compared with experimental shown at the bottom of the table and is similar to that shown
data within about 0.1%–5%. Note that d eq < d 60 results in in Table CD12.7, but modified.
lower values for (h h o )=h by perhaps 5%–10%. For an
estimate of bed expansion, the d 60 value is probably 2 0:5
adequate. R mf ¼ [33:7 þ 0:0408Ga] 33:7 (12:56)
d 90 v mf r
(12:57)
R mf ¼
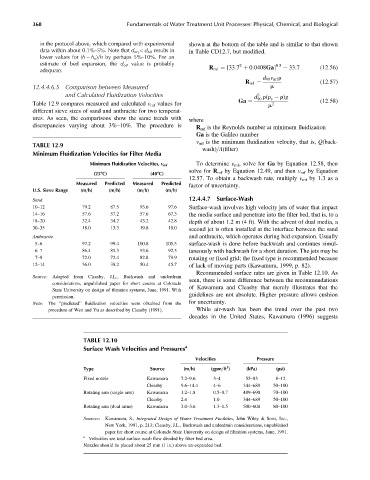
12.4.4.6.5 Comparison between Measured m
and Calculated Fluidization Velocities d r(r r)g
3
90 s
Table 12.9 compares measured and calculated v mf values for Ga ¼ m 2 (12:58)
different sieve sizes of sand and anthracite for two temperat-
ures. As seen, the comparisons show the same trends with where
discrepancies varying about 3%–10%. The procedure is R mf is the Reynolds number at minimum fluidization
Ga is the Galileo number
v mf is the minimum fluidization velocity, that is, Q(back-
TABLE 12.9
wash)=A(filter)
Minimum Fluidization Velocities for Filter Media
To determine v mf , solve for Ga by Equation 12.58, then
Minimum Fluidization Velocities, v mf
solve for R mf by Equation 12.49, and then v mf by Equation
(258C) (408C)
12.57. To obtain a backwash rate, multiply v mf by 1.3 as a
Measured Predicted Measured Predicted
factor of uncertainty.
U.S. Sieve Range (m=h) (m=h) (m=h) (m=h)
Sand 12.4.4.7 Surface-Wash
10–12 79.2 87.5 93.6 97.6 Surface-wash involves high velocity jets of water that impact
14–16 57.6 57.2 57.6 67.3 the media surface and penetrate into the filter bed, that is, to a
18–20 32.4 34.2 43.2 42.8 depth of about 1.2 m (4 ft). With the advent of dual media, a
30–35 18.0 13.3 19.8 18.0 second jet is often installed at the interface between the sand
Anthracite and anthracite, which operates during bed expansion. Usually
5–6 97.2 99.4 100.8 105.5 surface-wash is done before backwash and continues simul-
6–7 86.4 85.3 93.6 92.5 taneously with backwash for a short duration. The jets may be
7–8 72.0 72.4 82.8 79.9 rotating or fixed grid; the fixed type is recommended because
12–14 36.0 38.2 50.4 45.7 of lack of moving parts (Kawamura, 1999, p. 82).
Recommended surface rates are given in Table 12.10. As
Source: Adapted from Cleasby, J.L., Backwash and underdrain
seen, there is some difference between the recommendations
considerations, unpublished paper for short course at Colorado
of Kawamura and Cleasby that merely illustrates that the
State University on design of filtration systems, June, 1991. With
guidelines are not absolute. Higher pressure allows cushion
permission.
Note: The ‘‘predicted’’ fluidization velocities were obtained from the for uncertainty.
procedure of Wen and Yu as described by Cleasby (1991). While air-wash has been the trend over the past two
decades in the United States, Kawamura (1996) suggests
TABLE 12.10
Surface Wash Velocities and Pressures a
Velocities Pressure
2
Type Source (m=h) (gpm=ft ) (kPa) (psi)
Fixed nozzle Kawamura 7.2–9.6 3–4 55–83 8–12
Cleasby 9.6–14.4 4–6 344–689 50–100
Rotating arm (single arm) Kawamura 1.2–1.8 0.5–0.7 489–690 70–100
Cleasby 2.4 1.0 344–689 50–100
Rotating arm (dual arms) Kawamura 3.0–3.6 1.3–1.5 500–600 80–100
Sources: Kawamura, S., Integrated Design of Water Treatment Facilities, John Wiley & Sons, Inc.,
New York, 1991, p. 213; Cleasby, J.L., Backwash and underdrain considerations, unpublished
paper for short course at Colorado State University on design of filtration systems, June, 1991.
a
Velocities are total surface wash flow divided by filter bed area.
Nozzles should be placed about 25 mm (1 in.) above un-expanded bed.