
Page 412 - Fundamentals of Water Treatment Unit Processes : Physical, Chemical, and Biological
P. 412
Rapid Filtration 367
3. Calculation of minimum fluidization velocity, v mf .
TABLE 12.8 From Table CD12.7a,
Media Used to Compare Experimental and Calculated 2
Bed Expansions v mf ¼ 20:1m=h(8:2 gpm=ft )
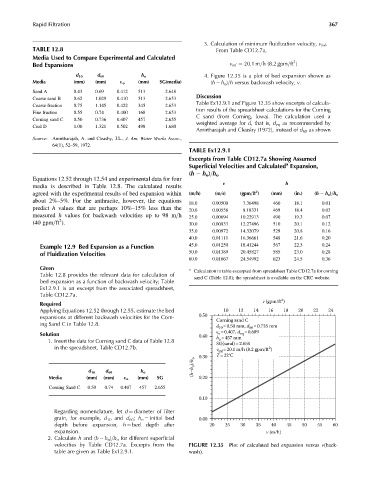
d 10 d 60 h o 4. Figure 12.35 is a plot of bed expansion shown as
Media (mm) (mm) « o (mm) SG(media) (h h o )=h versus backwash velocity, v.
Sand A 0.43 0.69 0.412 513 2.648
Discussion
Coarse sand B 0.62 1.029 0.410 513 2.653
Table Ex12.9.1 and Figure 12.35 show excerpts of calcula-
Coarse fraction 0.75 1.145 0.422 345 2.653
tion results of the spreadsheet calculations for the Corning
Fine fraction 0.55 0.74 0.400 168 2.653
C sand (from Corning, Iowa). The calculation used a
Corning sand C 0.50 0.736 0.407 457 2.655
weighted average for d,that is, d eq as recommended by
Coal D 1.00 1.321 0.502 498 1.680
Amirtharajah and Cleasby (1972), instead of d 60 as shown
Source: Amirtharajah, A. and Cleasby, J.L., J. Am. Water Works Assoc.,
64(1), 52–59, 1972.
TABLE Ex12.9.1
Excerpts from Table CD12.7a Showing Assumed
a
Superficial Velocities and Calculated Expansion,
(h h o )=h o
Equations 12.52 through 12.54 and experimental data for four
v h
media is described in Table 12.8. The calculated results
2
agreed with the experimental results of bed expansion within (m=h) (m=s) (gpm=ft ) (mm) (in.) (h h o )=h o
about 2%–5%. For the anthracite, however, the equations
18.0 0.00500 7.36498 460 18.1 0.01
predict h values that are perhaps 10%–15% less than the 20.0 0.00556 8.18331 469 18.4 0.03
measured h values for backwash velocities up to 98 m=h 25.0 0.00694 10.22913 490 19.3 0.07
2
(40 gpm=ft ). 30.0 0.00833 12.27496 510 20.1 0.12
35.0 0.00972 14.32079 529 20.8 0.16
40.0 0.01111 16.36661 548 21.6 0.20
Example 12.9 Bed Expansion as a Function 45.0 0.01250 18.41244 567 22.3 0.24
of Fluidization Velocities 50.0 0.01389 20.45827 585 23.0 0.28
60.0 0.01667 24.54992 623 24.5 0.36
Given a Calculation in table excerpted from spreadsheet Table CD12.7a for corning
Table 12.8 provides the relevant data for calculation of sand C (Table 12.8); the spreadsheet is available on the CRC website.
bed expansion as a function of backwash velocity; Table
Ex12.9.1 is an excerpt from the associated spreadsheet,
Table CD12.7a.
2
v (gpm/ft )
Required
Applying Equations 12.52 through 12.55, estimate the bed 10 12 14 16 18 20 22 24
expansions at different backwash velocities for the Corn- 0.50 Corning sand C
ing Sand C in Table 12.8. d =0.50 mm, d 60 =0.735 mm
10
Solution 0.40 ε o =0.407, d =0.689
eq
h =457 mm
o
1. Insert the data for Corning sand C data of Table 12.8 SG(sand) =2.655
in the spreadsheet, Table CD12.7b. 2
v mf =20.1 m/h (8.2 gpm/ft )
T =22°C
(h–h o )/h o 0.30
d 10 d 60 h o
Media (mm) (mm) « o (mm) SG 0.20
Corning Sand C 0.50 0.74 0.407 457 2.655
0.10
Regarding nomenclature, let d ¼ diameter of filter
grain, for example, d 10 and d 60 ; h o ¼ initial bed 0.00
depth before expansion, h ¼ bed depth after 20 25 30 35 40 45 50 55 60
expansion. v (m/h)
2. Calculate h and (h h o )=h o for different superficial
velocities by Table CD12.7a. Excerpts from the FIGURE 12.35 Plot of calculated bed expansion versus v(back-
table are given as Table Ex12.9.1. wash).