
Page 441 - Fundamentals of Water Treatment Unit Processes : Physical, Chemical, and Biological
P. 441
396 Fundamentals of Water Treatment Unit Processes: Physical, Chemical, and Biological
sand in reductions of turbidity and coliforms, respectively,
BOX 13.1 ORGANIZING DILEMMA
for example, as seen in the plots, log R(turbidity) 0.8, log
Slow sand has a history: it is the first successful tech- R(coliforms) 2.
nology for municipal drinking water treatment. The
1829 London filter (Sections 13.1.4.1 and 13.1.4.2) 13.1.2.3 Economy
was the foundation for present practice. Its design by
The economic attractiveness of slow sand depends upon the
James Simpson was based on studies of filtration efforts
context. The appeal in current times is mostly for small
that were not successful and was refined by a pilot plant
communities. Communities having populations of 1000 to
study. Therefore, because of its history that fits the
2000 persons, or even 5000 persons, should not be too
themes of the book, for example, principles, modeling,
large for slow sand to be ‘‘appropriate.’’ At larger plants,
pilot plants, practice, and, the fact that it is one of the
however, the labor costs of processing sand (i.e., cleaning)
important technologies that is ‘‘on-the-shelf’’ for use,
will be greater than the cost of operation for rapid filtration.
and is appropriate for many situations, and perhaps
The point of this crossover will depend upon circumstances.
because of sentiments about slow sand, the decision The City of Salem, Oregon, however, with a population of
was to allocate a chapter to the topic. 107,000 (serving 135,000) uses slow sand filtration, as
does West Hartford, Connecticut with a population of
300,000 served; some others are listed by Slezak and
To assess the overall performance of a slow sand filter, Sims (1984). In Germany, slow sand is not uncommon and
London has 47 ha (116 ac) of slow sand filters. Slow sand
cartridge filter sampling is useful. Figure 13.2 shows cartridge
has been adopted in recent times in developing countries
filters after sampling the influent raw water and the filter
(van Dijk and Oomen, 1978; Kerkhoven, 1979; Komolrit
effluent, respectively, for the slow sand filter at Empire,
et al., 1979; Alagarsamy and Gandhirajan, 1981; Paramasivam
Colorado. The visual inspection gives an impression of the
et al., 1981; van Markenlaan, 1981), and in Puerto Rico (Gaya,
overall effectiveness of the filtration process. If the influent
1992).
cartridge filter is black in color after 100–200 L of water
throughput and the effluent cartridge remains white (or off-
white), then high removals may be expected of all organisms, 13.1.2.4 Labor
for example, algae, cysts, bacteria, viruses, etc. Heterotrophic Most of the labor is in scraping the sand bed, removing the
plate counts may be higher in the effluent, however, due to the sand from the box, washing, moving sand to and from storage,
growths within the biofilm. Also, while high turbidity and rebuilding the sand bed. The frequency of scraping has
removals are expected, this may not always be the case, for been about monthly at Empire, Colorado (population 450) and
example, for particles 1 mm (Bellamy, 1984; Bellamy et al., required about 30–60 min for two persons for one filter bed
2
2
1985a,b). having an area of 76.5 m or 825 ft (Seelaus et al., 1986,
To provide more quantitative assessment of slow sand p. 4). The sand was deposited on the ground outside the filter,
effectiveness, Figure 13.3 shows influent and effluent turbid- however, which deferred the labor of storing the sand for later
ities and influent and effluent coliforms in (a) and (b), respect- washing and resanding. The plant required a daily visit for
ively; the data were compiled by Sims and Slezak (1991) from flow adjustment, water level measurements, turbidity meas-
results of a national performance survey of slow sand filtration urements, and recording of data. By contrast, the Denver
3
plants. The plots are indicative of the quality of raw water Kassler plant (151,000 m =day or 40 mgd) employed
sources used for slow sand and of the effectiveness of slow 20 persons for continuous activity in scraping, washing,
Diffusion cone
Control valve
Headwater
Tailwater Raw water
Schmutzdecke
Weir
Sand
Product
water Gravel
c
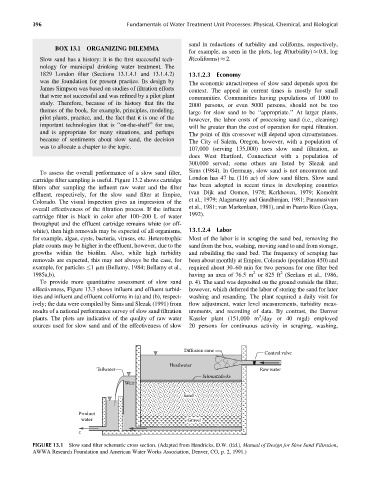
FIGURE 13.1 Slow sand filter schematic cross section. (Adapted from Hendricks, D.W. (Ed.), Manual of Design for Slow Sand Filtration,
AWWA Research Foundation and American Water Works Association, Denver, CO, p. 2, 1991.)