Page 768 - Fundamentals of Water Treatment Unit Processes : Physical, Chemical, and Biological
P. 768

Biological Reactors                                                                              723
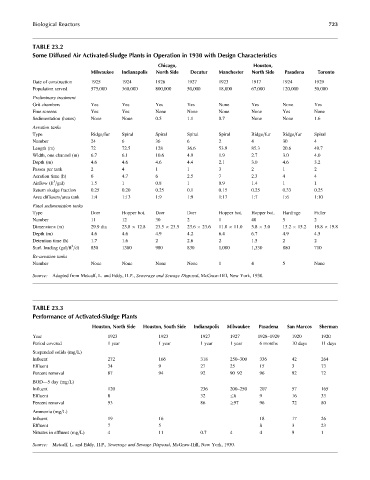


            TABLE 23.2
            Some Diffused Air Activated-Sludge Plants in Operation in 1930 with Design Characteristics
                                                     Chicago,                       Houston,
                               Milwaukee  Indianapolis  North Side  Decatur  Manchester  North Side  Pasadena  Toronto
            Date of construction  1925   1924       1926       1927      1923       1917      1924      1929
            Population served  575,000   360,000    800,000    50,000    18,000     67,000    120,000   50,000
            Preliminary treatment
            Grit chambers      Yes       Yes        Yes        Yes       None       Yes       None      Yes
            Fine screens       Yes       Yes        None       None      None       None      Yes       None
            Sedimentation (hours)  None  None       0.5        1.1       0.7        None      None      1.6
            Aeration tanks
            Type               Ridge=fur  Spiral    Spiral     Spiral    Spiral     Ridge=fur  Ridge=fur  Spiral
            Number             24        6          36         6         2          4         30        4
            Length (m)         72        72.5       128        36.6      53.9       85.3      20.6      49.7
            Width, one channel (m)  6.7  6.1        10.6       4.9       1.9        2.7       3.0       4.0
            Depth (m)          4.6       4.6        4.6        4.4       2.1        3.0       4.6       3.2
            Passes per tank    2         4          1          1         3          2         1         2
            Aeration time (h)  6         4.7        6          2.5       7          2.3       4         4
                   3
            Airflow (ft =gal)   1.5       1          0.8        1         0.9        1.4       1         1
            Return sludge fraction  0.25  0.20      0.25       0.1       0.15       0.25      0.33      0.25
            Area diffusers=area tank  1:4  1:13     1:9        1:9       1:17       1:7       1:6       1:10
            Final sedimentation tanks
            Type               Dorr      Hopper bot.  Dorr     Dorr      Hopper bot.  Hopper bot.  Hardinge  Fidler
            Number             11        12         30         2         1          40        5         2
            Dimensions (m)     29.9 dia  23.8   12.8  23.5   23.5  23.6   23.6  11.0   11.0  5.8   3.0  15.2   15.2  19.8   19.8
            Depth (m)          4.6       4.6        4.9        4.2       6.4        6.7       4.9       4.5
            Detention time (h)  1.7      1.6        2          2.6       2          1.5       2         2
                         2
            Surf. loading (gal=ft =d)  850  1380    980        830       1,000      1,330     880       710
            Re-aeration tanks
            Number             None      None       None       None      1          4         5         None
            Source: Adapted from Metcalf, L. and Eddy, H.P., Sewerage and Sewage Disposal, McGraw-Hill, New York, 1930.


            TABLE 23.3
            Performance of Activated-Sludge Plants

                               Houston, North Side  Houston, South Side  Indianapolis  Milwaukee  Pasadena  San Marcos  Sherman
            Year                     1923            1923          1927      1927     1928–1929  1920      1920
            Period covered           1 year          1 year        1 year    1 year   6 months   10 days   11 days
            Suspended solids (mg=L)
            Influent                  272             166           318       250–300  336        42        264
            Effluent                  34              9             27        25       15         3         73
            Percent removal          87              94            92        90–92    96         92        72
            BOD—5 day (mg=L)
            Influent                  120                           236       200–250  207        57        165
            Effluent                  8                             32         6       9          16        33
            Percent removal          93                            86         97      96         72        80
            Ammonia (mg=L)
            Influent                  19              16                               18         17        26
            Effluent                  7               5                                8          3         23
            Nitrates in effluent (mg=L)  4            11            0.7       4        4          9         1

            Source: Metcalf, L. and Eddy, H.P., Sewerage and Sewage Disposal, McGraw-Hill, New York, 1930.
   763   764   765   766   767   768   769   770   771   772   773