
Page 779 - Fundamentals of Water Treatment Unit Processes : Physical, Chemical, and Biological
P. 779
734 Fundamentals of Water Treatment Unit Processes: Physical, Chemical, and Biological
TABLE CD23.4
Excerpt from Excel Spreadsheet for Dynamic Activated-Sludge Model
Variable Group 1 Design Group 2 Coefficients Group 3 Operation
Type
Dependent S t ¼Calc. (mg=L) R ¼ assumed (L=h)
0
X t ¼Calc. (mg cells=L) R ¼ calculated (L=h)
Original Revised X ¼ 1,800 (mg cells=L)
1
Independent Q o ¼31.56 (mil L=d) m(hat) ¼ 0.205 0.25 (h ) X r ¼ 10,000 (mg cells=L)
Q e ¼31.56 (mil L=d) K m ¼ 5.8 300 (mg=L)
V ¼ 11650000 (L) Y ¼ 0.31 0.6
1
Time, t Calc. (h) k d ¼ 0.0042 0.0002 (h )
Incr., Dt 0.5 (h)
Inputs Recirculation=Wasting Substrate Degradation Cell Synthesis
Time Q o u S o R R 0 m S S(t þ Dt) X X(t þ Dt)
1
(h) (L=h) (h) (mg=L) (L=h) R=Q (L=h) (h ) (mg=L) (mg=L) (mg=L) (mg=L)
0.0 1,320,454 8.82 303 132,045 0.100 16,492 0.008 10.0 14.56 1800 1800
0.5 1,037,533 11.23 233 207,639 0.200 16,492 0.012 14.6 7.06 1800 1803
1.0 1,037,533 11.23 233 208,119 0.201 23,896 0.006 7.1 8.56 1803 1798
2·10 6 500
S o
1.5·10 6 400 S t
Q o (L/hr) 1·10 6 Infl./eff. BOD’s (mg/L) 300
200
5·10 5 100
Q o
0·10 0 0
0 5 10 15 20 25 0 5 10 15 20 25
(a) Time (h) (b) Time (h)
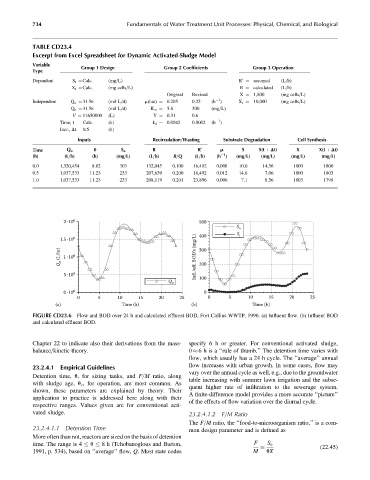
FIGURE CD23.6 Flow and BOD over 24 h and calculated effluent BOD, Fort Collins WWTP, 1990. (a) Influent flow. (b) Influent BOD
and calculated effluent BOD.
Chapter 22 to indicate also their derivations from the mass- specify 6 h or greater. For conventional activated sludge,
balance=kinetic theory. u 6 h is a ‘‘rule of thumb.’’ The detention time varies with
flow, which usually has a 24 h cycle. The ‘‘average’’ annual
flow increases with urban growth. In some cases, flow may
23.2.4.1 Empirical Guidelines
vary over the annual cycle as well, e.g., due to the groundwater
Detention time, u, for sizing tanks, and F=M ratio, along
table increasing with summer lawn irrigation and the subse-
with sludge age, u c , for operation, are most common. As
quent higher rate of infiltration to the sewerage system.
shown, these parameters are explained by theory. Their
A finite-difference model provides a more accurate ‘‘picture’’
application to practice is addressed here along with their
of the effects of flow variation over the diurnal cycle.
respective ranges. Values given are for conventional acti-
vated sludge. 23.2.4.1.2 F=M Ratio
The F=M ratio, the ‘‘food-to-microorganism ratio,’’ is a com-
23.2.4.1.1 Detention Time mon design parameter and is defined as
More often than not, reactors are sized on the basis of detention
time. The range is 4 u 8 h (Tchobanoglous and Burton, F S o
(22:45)
1991, p. 534), based on ‘‘average’’ flow, Q. Most state codes M uX