Page 789 - Fundamentals of Water Treatment Unit Processes : Physical, Chemical, and Biological
P. 789
744                            Fundamentals of Water Treatment Unit Processes: Physical, Chemical, and Biological


                0.30                                           net cell yields decline with the residence time in the reactor

                0.25      Carbohydrates                        due to the endogenous decay of organisms.
              Y (kg VSS/kg BOD L )  0.20                       As with aerobic reactions, Monod kinetics may apply to
                                                                        Kinetics
                                                               23.4.3.2
                0.15
                                                               anaerobic reactions, as reviewed in Section 22.5. The
                                                               Monod equation is restated,
                0.10
                0.05            Proteins                                                  S
                        Fatty acids                                               m ¼ ^m                  (22:31)
                0.00                                                                    K s þ S
                   0      5     10    15     20    25     30
                                    SRT (day)                  The kinetic equations apply to both stages of the anaerobic
                                                               process, i.e., acid formation or methane formation, or empir-
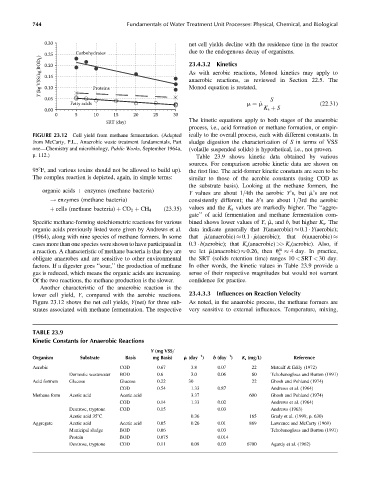
            FIGURE 23.12 Cell yield from methane fermentation. (Adapted  ically to the overall process, each with different constants. In
            from McCarty, P.L., Anaerobic waste treatment fundamentals, Part  sludge digestion the characterization of S in terms of VSS
            one—Chemistry and microbiology, Public Works, September 1964a,  (volatile suspended solids) is hypothetical, i.e., not proven.
            p. 112.)                                              Table 23.9 shows kinetic data obtained by various
                                                               sources. For comparison aerobic kinetic data are shown on
            958F, and various toxins should not be allowed to build up).  the first line. The acid-former kinetic constants are seen to be
            The complex reaction is depicted, again, in simple terms:  similar to those of the aerobic constants (using COD as
                                                               the substrate basis). Looking at the methane formers, the
               organic acids þ enzymes (methane bacteria)
                                                               Y values are about 1=4th the aerobic Y’s, but ^m’s are not
                  ! enzymes (methane bacteria)                 consistently different; the b’s are about 1=3rd the aerobic
                                                       (23:35)  values and the K s values are markedly higher. The ‘‘aggre-
                 þ cells (methane bacteria) þ CO 2 þ CH 4
                                                               gate’’ of acid fermentation and methane fermentation com-
            Specific methane-forming stoichiometric reactions for various  bined shows lower values of Y, ^m, and b, but higher K s . The
            organic acids previously listed were given by Andrews et al.  data indicate generally that Y(anaerobic)   0.1   Y(aerobic);
            (1964), along with nine species of methane formers. In some  that  ^ m(anaerobic)   0.1   ^m(aerobic);  that  b(anaerobic)
            cases more than one species were shown to have participated in  0.3   b(aerobic); that K s (anaerobic) >> K s (aerobic). Also, if
                                                                                             m
            a reaction. A characteristic of methane bacteria is that they are  we let ^m(anaerobic)   0.26, then u   4 day. In practice,
                                                                                             c
            obligate anaerobes and are sensitive to other environmental  the SRT (solids retention time) ranges 10 < SRT < 30 day.
            factors. If a digester goes ‘‘sour,’’ the production of methane  In other words, the kinetic values in Table 23.9 provide a
            gas is reduced, which means the organic acids are increasing.  sense of their respective magnitudes but would not warrant
            Of the two reactions, the methane production is the slower.  confidence for practice.
              Another characteristic of the anaerobic reaction is the
            lower cell yield, Y, compared with the aerobic reactions.  23.4.3.3  Influences on Reaction Velocity
            Figure 23.12 shows the net cell yields, Y(net) for three sub-  As noted, in the anaerobic process, the methane formers are
            strates associated with methane fermentation. The respective  very sensitive to external influences. Temperature, mixing,


            TABLE 23.9
            Kinetic Constants for Anaerobic Reactions
                                                   Y (mg VSS=
                                                                             1
                                                                   1
            Organism       Substrate      Basis    mg Basis)  ^ m (day )  b (day )  K s (mg=L)    Reference
            Aerobic                     COD          0.67       3.8      0.07       22    Metcalf & Eddy (1972)
                        Domestic wastewater  BOD     0.6        3.0      0.06       60    Tchobanoglous and Burton (1991)
            Acid formers  Glucose       Glucose      0.22      30                   22    Ghosh and Pohland (1974)
                                        COD          0.54       1.33     0.87             Andrews et al. (1964)
            Methane form  Acetic acid   Acetic acid             3.37               600    Ghosh and Pohland (1974)
                                        COD          0.14       1.33     0.02             Andrews et al. (1964)
                        Dextrose, tryptone  COD      0.15                0.03             Andrews (1963)
                        Acetic acid 358C                        0.36               165    Grady et al. (1999, p. 630)
            Aggregate   Acetic acid     Acetic acid  0.05       0.26     0.01      869    Lawrence and McCarty (1969)
                        Municipal sludge  BOD        0.06                0.03             Tchobanoglous and Burton (1991)
                        Protein         BOD          0.075               0.014
                        Dextrose, tryptone  COD      0.11       0.09     0.03     6700    Agardy et al. (1962)

