
Page 790 - Fundamentals of Water Treatment Unit Processes : Physical, Chemical, and Biological
P. 790
Biological Reactors 745
pH, and the reaction chemical environment all influence reac- Measurement of reaction rate. Kinetics can be in terms of any
tion velocity. Consequently, the reactor must be designed and of the reactants or products in a reaction equation. Once a rate
operated to maintain these conditions at ‘‘optimum’’ levels. In is measured for any one of the reactants or products in a
general 6.8 < pH(optimum) < 7.4 (Grady et al., 1999, p. 632). reaction, rates for any of the others may be calculated from
The problem may be exacerbated if the methane formers are the stoichiometric coefficients.
affected and reduce their activity, which permits the volatile Measurement of the rate of gas production from municipal
acid formation rate to exceed the methane production rate primary sludge was done by Pitkin (1969) at five temperat-
with a consequent accumulation of volatile acids resulting in ures, using a 1.00 L reactor in a water bath. Data are plotted in
a ‘‘sour’’ digester. Thus, monitoring volatile acids in the Figure 23.13 in accordance with the Arrhenius equation, i.e.,
digester is done in practice. If the volatile acids start to log(gas production rate) vs. (1=T). The solids concentration
accumulate, one remedy is to reduce the organic loading to was 4% for all measurements; the reactor volume was 1.00 L.
permit two reactions to regain a balance. To mitigate large The best fit equation for Figure 23.13 is
swings in pH, the alkalinity, present in the range of 1000–
5000 mg=L as CaCO 3 (Grady et al., 1999, p. 634), may act as dG 0 1
log ¼ 4735 þ 16:51 (23:38)
a buffer. Heavy metals and certain organic compounds may dt T
have an inhibiting effect.
where
23.4.3.4 Effect of Temperature G is the gas generated per unit of reactor volume (mL gas
0
The Arrhenius equation is the model for temperature effect, produced=L reactor volume)
dG =dt is the gas production rate (mL gas produced=L
0
reactor volume=h)
DE a
(23:36) T is the temperature (K)
RT
k ¼ A exp
Equation 23.38 can be restated as
or
dG 1
¼ 10 ½ 4735 ðÞþ16:51 (23:39)
T
dt
DE a
þ log A (23:37)
log k ¼
RT 3 3
To convert the rate of gas production to m gas produced=m
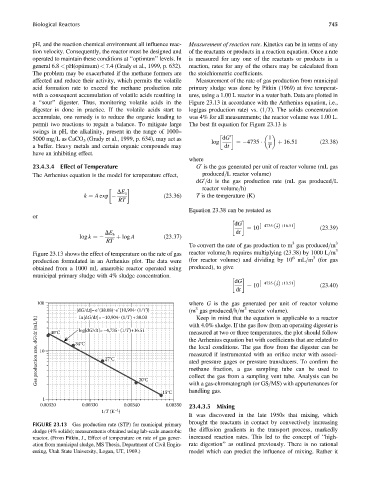
Figure 23.13 shows the effect of temperature on the rate of gas reactor volume=h requires multiplying (23.38) by 1000 L=m 3
6
3
production formulated in an Arrhenius plot. The data were (for reactor volume) and dividing by 10 mL=m (for gas
obtained from a 1000 mL anaerobic reactor operated using produced), to give
municipal primary sludge with 4% sludge concentration.
dG 1
¼ 10 ½ 4735 ðÞþ13:51 (23:40)
T
dt
100 where G is the gas generated per unit of reactor volume
3
3
[dG/dt]=eˆ(38.08) . eˆ{10,904 (1/T)} (m gas produced=h=m reactor volume).
.
(1/T)+38.03
Gas production rate, dG/dt (mL/h) 10 40°C 34°C 27°C . measured at two or three temperatures, the plot should follow
In[dG/dt]=–10,904 .
Keep in mind that the equation is applicable to a reactor
with 4.0% sludge. If the gas flow from an operating digester is
log[dG/dt]=–4,735 (1/T)+16.51
the Arrhenius equation but with coefficients that are related to
the local conditions. The gas flow from the digester can be
measured if instrumented with an orifice meter with associ-
ated pressure gages or pressure transducers. To confirm the
methane fraction, a gas sampling tube can be used to
20°C
with a gas-chromatograph (or GS=MS) with appurtenances for
handling gas.
15°C collect the gas from a sampling vent tube. Analysis can be
1
0.00320 0.00330 0.00340 0.00350 23.4.3.5 Mixing
–1
1/T (K )
It was discovered in the late 1950s that mixing, which
brought the reactants in contact by convectively increasing
FIGURE 23.13 Gas production rate (STP) for municipal primary
sludge (4% solids); measurements obtained using lab-scale anaerobic the diffusion gradients in the transport process, markedly
reactor. (From Pitkin, J., Effect of temperature on rate of gas gener- increased reaction rates. This led to the concept of ‘‘high-
ation from municipal sludge, MS Thesis, Department of Civil Engin- rate digestion’’ as outlined previously. There is no rational
eering, Utah State University, Logan, UT, 1969.) model which can predict the influence of mixing. Rather it