
Page 23 - Gas Purification 5E
P. 23
Introduction 13
O’Connell’s overall tray efficiency correlation (1946), Fair’s flooding correlation for sieve
tray columns (1961), Hughmark and O’Connell’s correlation relating to pressure drop of gas
through a dry tray (1957), Fair’s correlation for tray weeping (1963), and Eckert’s correlation
for flooding in a packed tower (1970A).
A number of commercially available software programs that include absorber design rou-
tines are listed in the CEP 1997 Software Directoly (Chem. Eng. Prog., 1997). A packed
tower design program for personal computers, which includes correlations for predicting the
efficiency and capacity of high efficiency structured packings, is described by Hausch and
Petschauer (1991). Detailed reviews of commonly used design procedures for absorption
operations are presented in several texts and articles including those of Edwards (1984), Fair
et al. (1984), Zenz (1979), Treybal (1980), Kohl (1987);and Diab and Maddox (1982). A
brief summary of the principal design equations and correlations is presented in the follow-
ing sections.
Material and Energy Balance
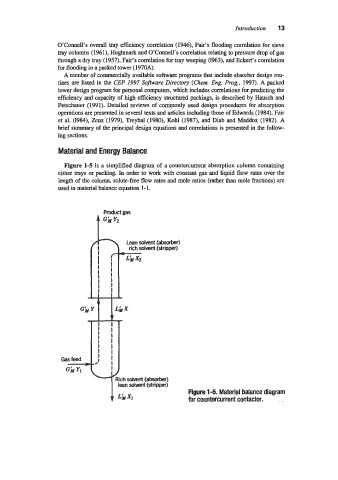
Figure 1-5 is a simplified diagram of a countercurrent absorption column containing
either trays or packing. In order to work with constant gas and liquid flow rates over the
length of the column, solute-free flow rates and mole ratios (rather than mole fractions) are
used in material balance equation 1-1.
Lean solvent (absorber)
rich solvent (stripper)
G; Y
Gas feed T ‘ I
1
Figure 1-5. Material balance diagram
for Countercurrent contactor.