
Page 167 - Gas Wettability of Reservoir Rock Surfaces with Porous Media
P. 167
Effect of Gas Wettability on the Surface Properties CHAPTER 4 151
3000
2500 Water wetting core
Gas wetting core
Resistivity, Ω.m 1500
2000
1000
500
0 200 400 600 800 1000
Frequency, KHZ
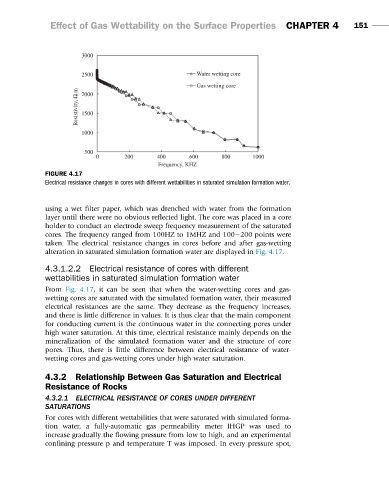
FIGURE 4.17
Electrical resistance changes in cores with different wettabilities in saturated simulation formation water.
using a wet filter paper, which was drenched with water from the formation
layer until there were no obvious reflected light. The core was placed in a core
holder to conduct an electrode sweep frequency measurement of the saturated
cores. The frequency ranged from 100HZ to 1MHZ and 100 200 points were
taken. The electrical resistance changes in cores before and after gas-wetting
alteration in saturated simulation formation water are displayed in Fig. 4.17.
4.3.1.2.2 Electrical resistance of cores with different
wettabilities in saturated simulation formation water
From Fig. 4.17, it can be seen that when the water-wetting cores and gas-
wetting cores are saturated with the simulated formation water, their measured
electrical resistances are the same. They decrease as the frequency increases,
and there is little difference in values. It is thus clear that the main component
for conducting current is the continuous water in the connecting pores under
high water saturation. At this time, electrical resistance mainly depends on the
mineralization of the simulated formation water and the structure of core
pores. Thus, there is little difference between electrical resistance of water-
wetting cores and gas-wetting cores under high water saturation.
4.3.2 Relationship Between Gas Saturation and Electrical
Resistance of Rocks
4.3.2.1 ELECTRICAL RESISTANCE OF CORES UNDER DIFFERENT
SATURATIONS
For cores with different wettabilities that were saturated with simulated forma-
tion water, a fully-automatic gas permeability meter JHGP was used to
increase gradually the flowing pressure from low to high, and an experimental
confining pressure p and temperature T was imposed. In every pressure spot,