
Page 165 - Gas Wettability of Reservoir Rock Surfaces with Porous Media
P. 165
Effect of Gas Wettability on the Surface Properties CHAPTER 4 149
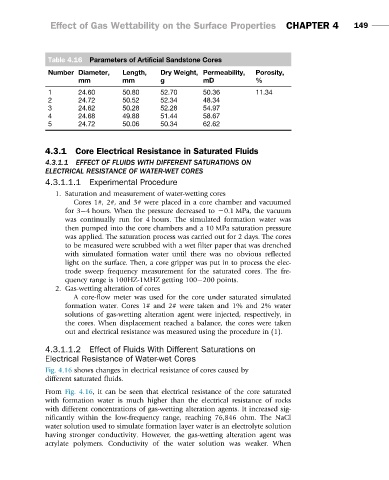
Table 4.16 Parameters of Artificial Sandstone Cores
Number Diameter, Length, Dry Weight, Permeability, Porosity,
mm mm g mD %
1 24.60 50.80 52.70 50.36 11.34
2 24.72 50.52 52.34 48.34
3 24.62 50.28 52.28 54.97
4 24.68 49.88 51.44 58.67
5 24.72 50.06 50.34 62.62
4.3.1 Core Electrical Resistance in Saturated Fluids
4.3.1.1 EFFECT OF FLUIDS WITH DIFFERENT SATURATIONS ON
ELECTRICAL RESISTANCE OF WATER-WET CORES
4.3.1.1.1 Experimental Procedure
1. Saturation and measurement of water-wetting cores
Cores 1#, 2#, and 3# were placed in a core chamber and vacuumed
for 3 4 hours. When the pressure decreased to 20.1 MPa, the vacuum
was continually run for 4 hours. The simulated formation water was
then pumped into the core chambers and a 10 MPa saturation pressure
was applied. The saturation process was carried out for 2 days. The cores
to be measured were scrubbed with a wet filter paper that was drenched
with simulated formation water until there was no obvious reflected
light on the surface. Then, a core gripper was put in to process the elec-
trode sweep frequency measurement for the saturated cores. The fre-
quency range is 100HZ-1MHZ getting 100 200 points.
2. Gas-wetting alteration of cores
A core-flow meter was used for the core under saturated simulated
formation water. Cores 1# and 2# were taken and 1% and 2% water
solutions of gas-wetting alteration agent were injected, respectively, in
the cores. When displacement reached a balance, the cores were taken
out and electrical resistance was measured using the procedure in (1).
4.3.1.1.2 Effect of Fluids With Different Saturations on
Electrical Resistance of Water-wet Cores
Fig. 4.16 shows changes in electrical resistance of cores caused by
different saturated fluids.
From Fig. 4.16, it can be seen that electrical resistance of the core saturated
with formation water is much higher than the electrical resistance of rocks
with different concentrations of gas-wetting alteration agents. It increased sig-
nificantly within the low-frequency range, reaching 76,846 ohm. The NaCl
water solution used to simulate formation layer water is an electrolyte solution
having stronger conductivity. However, the gas-wetting alteration agent was
acrylate polymers. Conductivity of the water solution was weaker. When