
Page 168 - Gas Wettability of Reservoir Rock Surfaces with Porous Media
P. 168
152 Gas Wettability of Reservoir Rock Surfaces with Porous Media
20,000
18,000 82.94
16,000
14,000 74.85
Resistivity, Ω.m 10,000
12,000
8000
6000
Gas wetting core
4000
Water wetting core
2000
0
0 20 40 60 80 100
Gas saturation, %
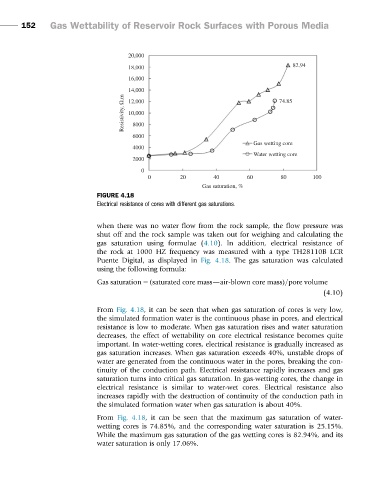
FIGURE 4.18
Electrical resistance of cores with different gas saturations.
when there was no water flow from the rock sample, the flow pressure was
shut off and the rock sample was taken out for weighing and calculating the
gas saturation using formulae (4.10). In addition, electrical resistance of
the rock at 1000 HZ frequency was measured with a type TH28110B LCR
Puente Digital, as displayed in Fig. 4.18. The gas saturation was calculated
using the following formula:
Gas saturation 5 saturated core mass air-blown core massÞ=pore volume
ð
(4.10)
From Fig. 4.18, it can be seen that when gas saturation of cores is very low,
the simulated formation water is the continuous phase in pores, and electrical
resistance is low to moderate. When gas saturation rises and water saturation
decreases, the effect of wettability on core electrical resistance becomes quite
important. In water-wetting cores, electrical resistance is gradually increased as
gas saturation increases. When gas saturation exceeds 40%, unstable drops of
water are generated from the continuous water in the pores, breaking the con-
tinuity of the conduction path. Electrical resistance rapidly increases and gas
saturation turns into critical gas saturation. In gas-wetting cores, the change in
electrical resistance is similar to water-wet cores. Electrical resistance also
increases rapidly with the destruction of continuity of the conduction path in
the simulated formation water when gas saturation is about 40%.
From Fig. 4.18, it can be seen that the maximum gas saturation of water-
wetting cores is 74.85%, and the corresponding water saturation is 25.15%.
While the maximum gas saturation of the gas wetting cores is 82.94%, and its
water saturation is only 17.06%.