
Page 152 - Gas Adsorption Equilibria
P. 152
138 Chapter 3
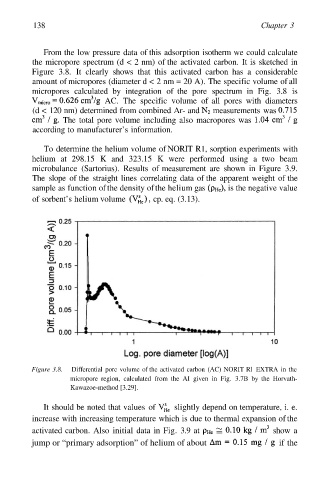
From the low pressure data of this adsorption isotherm we could calculate
the micropore spectrum (d < 2 nm) of the activated carbon. It is sketched in
Figure 3.8. It clearly shows that this activated carbon has a considerable
amount of micropores (diameter d < 2 nm = 20 A). The specific volume of all
micropores calculated by integration of the pore spectrum in Fig. 3.8 is
AC. The specific volume of all pores with diameters
(d < 120 nm) determined from combined Ar- and measurements was
The total pore volume including also macropores was
according to manufacturer’s information.
To determine the helium volume of NORIT R1, sorption experiments with
helium at 298.15 K and 323.15 K were performed using a two beam
microbalance (Sartorius). Results of measurement are shown in Figure 3.9.
The slope of the straight lines correlating data of the apparent weight of the
sample as function of the density of the helium gas is the negative value
of sorbent’s helium volume cp. eq. (3.13).
Figure 3.8. Differential pore volume of the activated carbon (AC) NORIT Rl EXTRA in the
micropore region, calculated from the AI given in Fig. 3.7B by the Horvath-
Kawazoe-method [3.29].
It should be noted that values of slightly depend on temperature, i. e.
increase with increasing temperature which is due to thermal expansion of the
activated carbon. Also initial data in Fig. 3.9 at show a
jump or “primary adsorption” of helium of about if the