
Page 155 - Gas Adsorption Equilibria
P. 155
3. Gravimetry 141
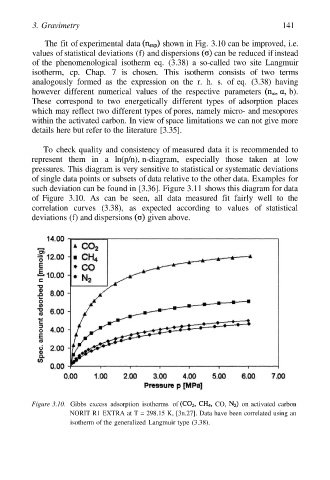
The fit of experimental data shown in Fig. 3.10 can be improved, i.e.
values of statistical deviations (f) and dispersions can be reduced if instead
of the phenomenological isotherm eq. (3.38) a so-called two site Langmuir
isotherm, cp. Chap. 7 is chosen. This isotherm consists of two terms
analogously formed as the expression on the r. h. s. of eq. (3.38) having
however different numerical values of the respective parameters b).
These correspond to two energetically different types of adsorption places
which may reflect two different types of pores, namely micro- and mesopores
within the activated carbon. In view of space limitations we can not give more
details here but refer to the literature [3.35].
To check quality and consistency of measured data it is recommended to
represent them in a ln(p/n), n-diagram, especially those taken at low
pressures. This diagram is very sensitive to statistical or systematic deviations
of single data points or subsets of data relative to the other data. Examples for
such deviation can be found in [3.36]. Figure 3.11 shows this diagram for data
of Figure 3.10. As can be seen, all data measured fit fairly well to the
correlation curves (3.38), as expected according to values of statistical
deviations (f) and dispersions given above.
Figure 3.10. Gibbs excess adsorption isotherms of CO, on activated carbon
NORIT R1 EXTRA at T = 298.15 K, [3n.27]. Data have been correlated using an
isotherm of the generalized Langmuir type (3.38).