
Page 160 - Gas Adsorption Equilibria
P. 160
146 Chapter 3
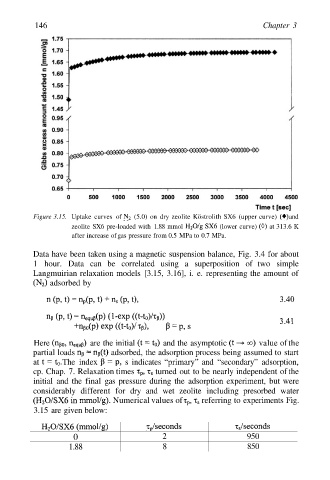
Figure 3.15. Uptake curves of (5.0) on dry zeolite Köstrolith SX6 (upper curve) and
zeolite SX6 pre-loaded with 1.88 mmol (lower curve) at 313.6 K
after increase of gas pressure from 0.5 MPa to 0.7 MPa.
Data have been taken using a magnetic suspension balance, Fig. 3.4 for about
1 hour. Data can be correlated using a superposition of two simple
Langmuirian relaxation models [3.15, 3.16], i. e. representing the amount of
adsorbed by
Here are the initial and the asymptotic value of the
partial loads adsorbed, the adsorption process being assumed to start
at The index s indicates “primary” and “secondary” adsorption,
cp. Chap. 7. Relaxation times turned out to be nearly independent of the
initial and the final gas pressure during the adsorption experiment, but were
considerably different for dry and wet zeolite including presorbed water
Numerical values of referring to experiments Fig.
3.15 are given below:
0 2 950
1.88 8 850