
Page 162 - Gas Adsorption Equilibria
P. 162
148 Chapter 3
Data have been correlated by using a generalized AI of Langmuir type, eq.
(3.38). As can be seen from the figure, due to presorption of water of about 50
% of the limiting molar amount of the capacity for is
reduced by ca. 40 %. We expect that part of the adsorbed on zeolite with
presorbed water will be dissolved in the “surface-water”. In view of
experimental difficulties we have not been able to do truly binary
coadsorption measurements for at near ambient
temperatures. Consequently we do not know the composition of the adsorbed
phase for sure but leave this question open to the interested experimenter.
Example 4
High pressure adsorption of and on activated carbon NORIT R1
EXTRA in the temperature range 298 K – 343 K for pressures up to
50 MPa.
Adsorption equilibria of the above kind have been measured at the
Institute of Non-Classical Chemistry, University of Leipzig, Leipzig,
Germany during 1999-2003. A high pressure version of a magnetic
suspension balance allowing measurements up to 50 MPa was used.
Experimental details of the instrument and the measurement procedure
including data correlation are given in [3.26, 3.39]. In view of space
limitations we only present graphically the gravimetrically determined
reduced mass cp. (3.5) and the Gibbs excess mass in the
helium approximation, i. e. cp. (3.14) for nitrogen
(5.0)) and carbon dioxide (4.5)) at four different temperatures (298
K, 313 K, 328 K, 343 K), Figs. 3.17 – 3.20. Uncertainties of data are
approximately twice the size of the graphical symbols used for presentation
[3.26].
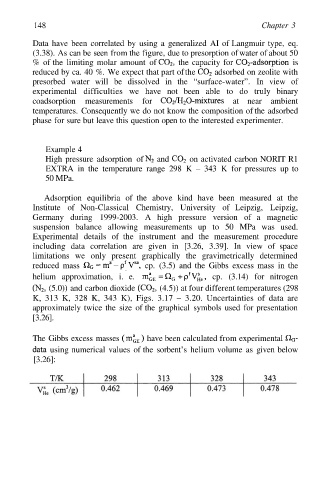
The Gibbs excess masses have been calculated from experimental
using numerical values of the sorbent’s helium volume as given below
[3.26]: