
Page 156 - Gas Adsorption Equilibria
P. 156
142 Chapter 3
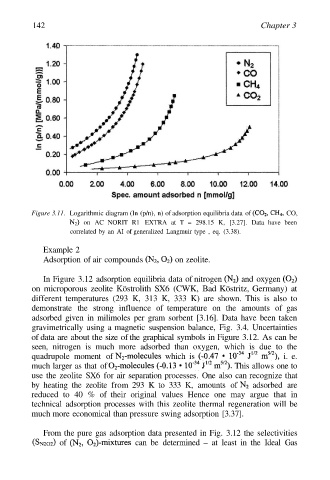
Figure 3.11. Logarithmic diagram (In (p/n), n) of adsorption equilibria data of CO,
on AC NORIT R1 EXTRA at T = 298.15 K, [3.27]. Data have been
correlated by an AI of generalized Langmuir type , eq. (3.38).
Example 2
Adsorption of air compounds on zeolite.
In Figure 3.12 adsorption equilibria data of nitrogen and oxygen
on microporous zeolite Köstrolith SX6 (CWK, Bad Köstritz, Germany) at
different temperatures (293 K, 313 K, 333 K) are shown. This is also to
demonstrate the strong influence of temperature on the amounts of gas
adsorbed given in milimoles per gram sorbent [3.16]. Data have been taken
gravimetrically using a magnetic suspension balance, Fig. 3.4. Uncertainties
of data are about the size of the graphical symbols in Figure 3.12. As can be
seen, nitrogen is much more adsorbed than oxygen, which is due to the
quadrupole moment of which is i. e.
much larger as that of This allows one to
use the zeolite SX6 for air separation processes. One also can recognize that
by heating the zeolite from 293 K to 333 K, amounts of adsorbed are
reduced to 40 % of their original values Hence one may argue that in
technical adsorption processes with this zeolite thermal regeneration will be
much more economical than pressure swing adsorption [3.37].
From the pure gas adsorption data presented in Fig. 3.12 the selectivities
of can be determined – at least in the Ideal Gas