
Page 217 - Gas Adsorption Equilibria
P. 217
4. Volumetric – Gravimetric Measurements 203
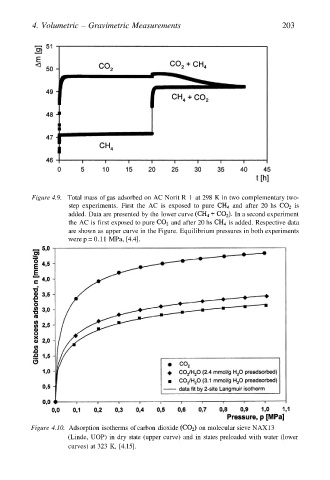
Figure 4.9. Total mass of gas adsorbed on AC Norit R 1 at 298 K in two complementary two-
step experiments. First the AC is exposed to pure and after 20 hs is
added. Data are presented by the lower curve In a second experiment
the AC is first exposed to pure and after 20 hs is added. Respective data
are shown as upper curve in the Figure. Equilibrium pressures in both experiments
were p = 0.11 MPa, [4.4].
Figure 4.10. Adsorption isotherms of carbon dioxide on molecular sieve NAX13
(Linde, UOP) in dry state (upper curve) and in states preloaded with water (lower
curves) at 323 K, [4.15].