
Page 212 - Gas Adsorption Equilibria
P. 212
198 Chapter 4
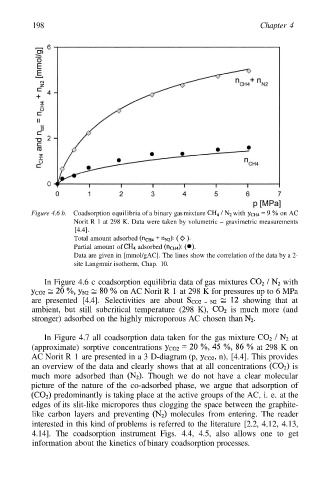
Figure 4.6 b. Coadsorption equilibria of a binary gas mixture with on AC
Norit R 1 at 298 K. Data were taken by volumetric – gravimetric measurements
[4.4].
Total amount adsorbed
Partial amount of adsorbed
Data are given in [mmol/gAC]. The lines show the correlation of the data by a 2-
site Langmuir isotherm, Chap. 10.
In Figure 4.6 c coadsorption equilibria data of gas mixtures with
on AC Norit R 1 at 298 K for pressures up to 6 MPa
are presented [4.4]. Selectivities are about showing that at
ambient, but still subcritical temperature (298 K), is much more (and
stronger) adsorbed on the highly microporous AC chosen than
In Figure 4.7 all coadsorption data taken for the gas mixture at
(approximate) sorptive concentrations at 298 K on
AC Norit R 1 are presented in a 3 D-diagram (p, n), [4.4]. This provides
an overview of the data and clearly shows that at all concentrations is
much more adsorbed than Though we do not have a clear molecular
picture of the nature of the co-adsorbed phase, we argue that adsorption of
predominantly is taking place at the active groups of the AC, i. e. at the
edges of its slit-like micropores thus clogging the space between the graphite-
like carbon layers and preventing molecules from entering. The reader
interested in this kind of problems is referred to the literature [2.2, 4.12, 4.13,
4.14]. The coadsorption instrument Figs. 4.4, 4.5, also allows one to get
information about the kinetics of binary coadsorption processes.