
Page 214 - Gas Adsorption Equilibria
P. 214
200 Chapter 4
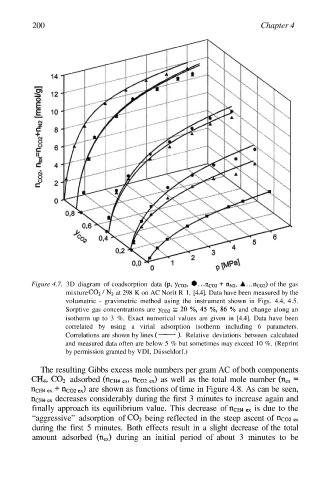
Figure 4.7. 3D diagram of coadsorption data of the gas
mixture at 298 K on AC Norit R 1, [4.4]. Data have been measured by the
volumetric - gravimetric method using the instrument shown in Figs. 4.4, 4.5.
Sorptive gas concentrations are and change along an
isotherm up to 3 %. Exact numerical values are given in [4.4]. Data have been
correlated by using a virial adsorption isotherm including 6 parameters.
Correlations are shown by lines Relative deviations between calculated
and measured data often are below 5 % but sometimes may exceed 10 %. (Reprint
by permission granted by VDI, Düsseldorf.)
The resulting Gibbs excess mole numbers per gram AC of both components
adsorbed as well as the total mole number
are shown as functions of time in Figure 4.8. As can be seen,
decreases considerably during the first 3 minutes to increase again and
finally approach its equilibrium value. This decrease of is due to the
“aggressive” adsorption of being reflected in the steep ascent of
during the first 5 minutes. Both effects result in a slight decrease of the total
amount adsorbed during an initial period of about 3 minutes to be