
Page 54 - Gas Adsorption Equilibria
P. 54
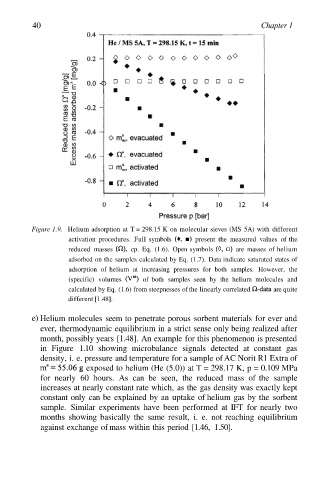
40                                                          Chapter 1


          Figure 1.9. Helium adsorption  at T = 298.15 K on molecular sieves (MS  5A) with different
                   activation procedures.  Full  symbols  present the measured  values of the
                   reduced  masses  cp.  Eq.  (1.6). Open symbols  are  masses of helium
                   adsorbed on the samples calculated by Eq. (1.7). Data indicate saturated states of
                   adsorption of  helium at  increasing pressures  for both  samples.  However, the
                   (specific) volumes  of both samples seen by  the  helium  molecules and
                   calculated by Eq. (1.6) from steepnesses of the linearly correlated  are  quite
                   different [1.48].

          e) Helium molecules seem to penetrate porous sorbent materials for ever and
            ever, thermodynamic equilibrium in a strict sense only being realized after
            month, possibly years [1.48]. An example for this phenomenon is presented
            in Figure  1.10  showing microbalance  signals detected at  constant gas
            density, i. e. pressure and temperature for a sample of AC Norit R1 Extra of
                        exposed to helium (He (5.0)) at T = 298.17 K, p = 0.109 MPa
            for  nearly 60  hours. As can  be  seen, the  reduced mass  of the  sample
            increases at nearly constant rate which, as the gas density was exactly kept
            constant only can be  explained by an uptake of helium gas by the  sorbent
            sample. Similar  experiments  have  been  performed at  IFT  for nearly two
            months showing basically the  same  result, i.  e. not reaching equilibrium
            against exchange of mass within this period [1.46, 1.50].