
Page 291 - gas transport in porous media
P. 291
288
35 Sensitivity of flow model to permeability Rossabi
30
25
20
15
10 5
Flow (lpm) -5 0
-10
-15
-20
Flow data
-25 20 Darcy Model
40 Darcy Model
-30 60 Darcy Model
-35
0 5 10 15 20 25
Time (days)
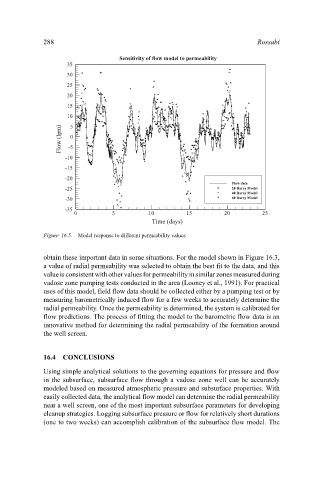
Figure 16.5. Model response to different permeability values
obtain these important data in some situations. For the model shown in Figure 16.3,
a value of radial permeability was selected to obtain the best fit to the data, and this
value is consistent with other values for permeability in similar zones measured during
vadose zone pumping tests conducted in the area (Looney et al., 1991). For practical
uses of this model, field flow data should be collected either by a pumping test or by
measuring barometrically induced flow for a few weeks to accurately determine the
radial permeability. Once the permeability is determined, the system is calibrated for
flow predictions. The process of fitting the model to the barometric flow data is an
innovative method for determining the radial permeability of the formation around
the well screen.
16.4 CONCLUSIONS
Using simple analytical solutions to the governing equations for pressure and flow
in the subsurface, subsurface flow through a vadose zone well can be accurately
modeled based on measured atmospheric pressure and subsurface properties. With
easily collected data, the analytical flow model can determine the radial permeability
near a well screen, one of the most important subsurface parameters for developing
cleanup strategies. Logging subsurface pressure or flow for relatively short durations
(one to two weeks) can accomplish calibration of the subsurface flow model. The