
Page 288 - gas transport in porous media
P. 288
285
Chapter 16: Analyzing Barometric Pumping
might result from the presence of multiple fluid phases. This assumption is generally
valid at depths greater than 3 meters where saturation values are not dramatically
affected by infiltration events and the assumption of a constant value for S g is not
unreasonable. For shallower depths, however, variable gas saturation values can have
a significant impact on flow predictions.
16.3 FIELD RESULTS AND MODEL PREDICTIONS
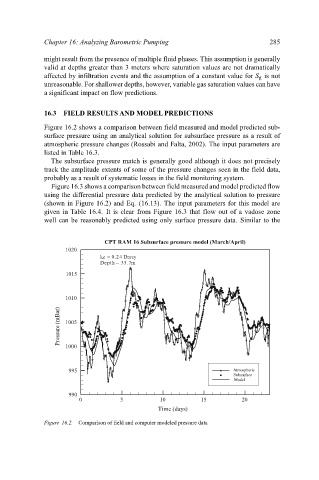
Figure 16.2 shows a comparison between field measured and model predicted sub-
surface pressure using an analytical solution for subsurface pressure as a result of
atmospheric pressure changes (Rossabi and Falta, 2002). The input parameters are
listed in Table 16.3.
The subsurface pressure match is generally good although it does not precisely
track the amplitude extents of some of the pressure changes seen in the field data,
probably as a result of systematic losses in the field monitoring system.
Figure 16.3 shows a comparison between field measured and model predicted flow
using the differential pressure data predicted by the analytical solution to pressure
(shown in Figure 16.2) and Eq. (16.13). The input parameters for this model are
given in Table 16.4. It is clear from Figure 16.3 that flow out of a vadose zone
well can be reasonably predicted using only surface pressure data. Similar to the
CPT RAM 16 Subsurface pressure model (March/April)
1020
kz = 0.24 Darcy
Depth = 33.7m
1015
1010
Pressure (mBar) 1005
1000
995 Atmospheric
Subsurface
Model
990
0 5 10 15 20
Time (days)
Figure 16.2. Comparison of field and computer modeled pressure data