
Page 289 - gas transport in porous media
P. 289
286
Table 16.3. List of input parameters for model Barosolv
Porosity = 0.4 Well radius = 1.27 cm Rossabi
Gas phase saturation (S g ) = 0.25 Depth of well = 32.2 m
Depth of water table = 39.6 m
Average pressure = 100.4 kPa Calibrated vertical permeability (k z ) = 2.4E-13m 2
Differential pressure data continuously logged at 10 minute intervals from 3/18/94 to 4/25/94.
Comparison of measured and modeled flow data
(Using only surface pressure data)
25
kr = 40 Darcy
20
15
10
5
Flow (lpm) –5 0
–10
–15
Field data
–20 Surface P model
–25
0 5 10 15 20
Time (days)
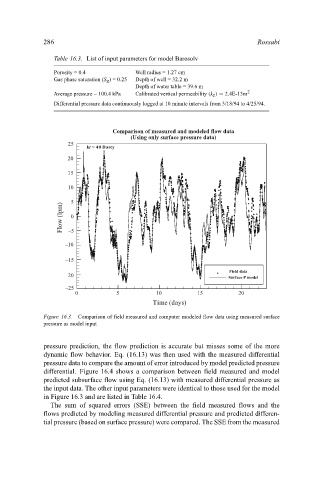
Figure 16.3. Comparison of field measured and computer modeled flow data using measured surface
pressure as model input
pressure prediction, the flow prediction is accurate but misses some of the more
dynamic flow behavior. Eq. (16.13) was then used with the measured differential
pressure data to compare the amount of error introduced by model predicted pressure
differential. Figure 16.4 shows a comparison between field measured and model
predicted subsurface flow using Eq. (16.13) with measured differential pressure as
the input data. The other input parameters were identical to those used for the model
in Figure 16.3 and are listed in Table 16.4.
The sum of squared errors (SSE) between the field measured flows and the
flows predicted by modeling measured differential pressure and predicted differen-
tial pressure (based on surface pressure) were compared. The SSE from the measured