
Page 290 - gas transport in porous media
P. 290
Chapter 16: Analyzing Barometric Pumping
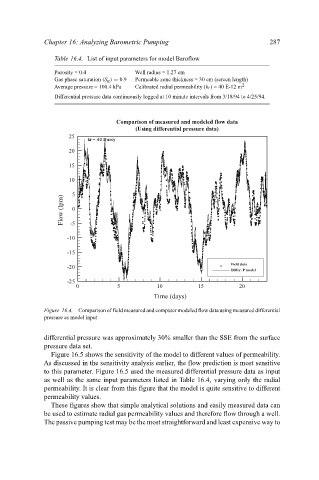
Table 16.4. List of input parameters for model Baroflow
Porosity = 0.4 Well radius = 1.27 cm 287
Gas phase saturation (S g ) = 0.9 Permeable zone thickness = 30 cm (screen length)
Average pressure = 100.4 kPa Calibrated radial permeability (k r ) = 40 E-12 m 2
Differential pressure data continuously logged at 10 minute intervals from 3/18/94 to 4/25/94.
Comparison of measured and modeled flow data
(Using differential pressure data)
25
kr = 40 Darcy
20
15
10
5
Flow (lpm) -5 0
-10
-15
Field data
-20
Differ. P model
-25
0 5 10 15 20
Time (days)
Figure 16.4. Comparison of field measured and computer modeled flow data using measured differential
pressure as model input
differential pressure was approximately 30% smaller than the SSE from the surface
pressure data set.
Figure 16.5 shows the sensitivity of the model to different values of permeability.
As discussed in the sensitivity analysis earlier, the flow prediction is most sensitive
to this parameter. Figure 16.5 used the measured differential pressure data as input
as well as the same input parameters listed in Table 16.4, varying only the radial
permeability. It is clear from this figure that the model is quite sensitive to different
permeability values.
These figures show that simple analytical solutions and easily measured data can
be used to estimate radial gas permeability values and therefore flow through a well.
The passive pumping test may be the most straightforward and least expensive way to