
Page 182 - Geochemical Anomaly and Mineral Prospectivity Mapping in GIS
P. 182
Analysis of Geologic Controls on Mineral Occurrence 183
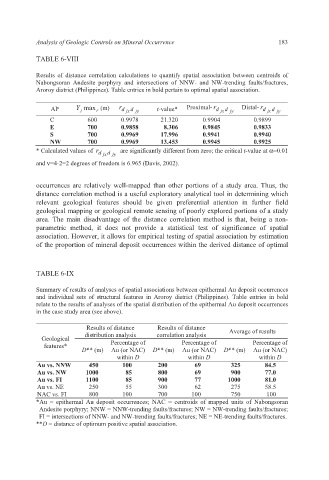
TABLE 6-VIII
Results of distance correlation calculations to quantify spatial association between centroids of
Nabongsoran Andesite porphyry and intersections of NNW- and NW-trending faults/fractures,
Aroroy district (Philippines). Table entries in bold pertain to optimal spatial association.
AP Y max (m) r d jx d jy t-value* Proximal- r d jx d jy Distal- r d jx d jy
r
j
C 600 0.9978 21.320 0.9904 0.9899
E 700 0.9858 8.306 0.9845 0.9833
S 700 0.9969 17.996 0.9941 0.9940
NW 700 0.9969 13.453 0.9945 0.9925
* Calculated values of r d jx d jy are significantly different from zero; the critical t-value at α=0.01
and ν=4-2=2 degrees of freedom is 6.965 (Davis, 2002).
occurrences are relatively well-mapped than other portions of a study area. Thus, the
distance correlation method is a useful exploratory analytical tool in determining which
relevant geological features should be given preferential attention in further field
geological mapping or geological remote sensing of poorly explored portions of a study
area. The main disadvantage of the distance correlation method is that, being a non-
parametric method, it does not provide a statistical test of significance of spatial
association. However, it allows for empirical testing of spatial association by estimation
of the proportion of mineral deposit occurrences within the derived distance of optimal
TABLE 6-IX
Summary of results of analyses of spatial associations between epithermal Au deposit occurrences
and individual sets of structural features in Aroroy district (Philippines). Table entries in bold
relate to the results of analyses of the spatial distribution of the epithermal Au deposit occurrences
in the case study area (see above).
Results of distance Results of distance
distribution analysis correlation analysis Average of results
Geological
features* Percentage of Percentage of Percentage of
D** (m) Au (or NAC) D** (m) Au (or NAC) D** (m) Au (or NAC)
within D within D within D
Au vs. NNW 450 100 200 69 325 84.5
Au vs. NW 1000 85 800 69 900 77.0
Au vs. FI 1100 85 900 77 1000 81.0
Au vs. NE 250 55 300 62 275 58.5
NAC vs. FI 800 100 700 100 750 100
*Au = epithermal Au deposit occurrences; NAC = centroids of mapped units of Nabongsoran
Andesite porphyry; NNW = NNW-trending faults/fractures; NW = NW-trending faults/fractures;
FI = intersections of NNW- and NW-trending faults/fractures; NE = NE-trending faults/fractures.
**D = distance of optimum positive spatial association.