
Page 180 - Geochemical Anomaly and Mineral Prospectivity Mapping in GIS
P. 180
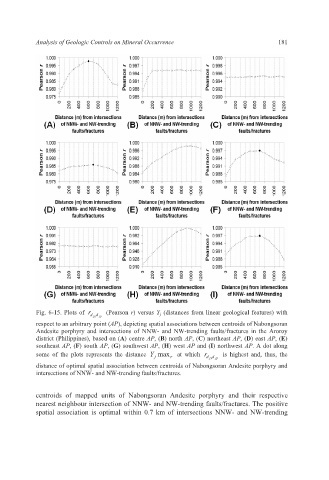
Analysis of Geologic Controls on Mineral Occurrence                  181


           Fig. 6-15. Plots of  r d jx d  jy   (Pearson r) versus Y j (distances from linear geological features) with

           respect to an arbitrary point (AP), depicting spatial associations between centroids of Nabongsoran
           Andesite porphyry  and intersections of NNW- and NW-trending faults/fractures in the Aroroy
           district (Philippines), based on (A) centre AP, (B) north AP, (C) northeast AP, (D) east AP, (E)
           southeast AP, (F) south AP, (G) southwest AP, (H) west AP and (I) northwest AP. A dot along
           some of the plots represents the distance  Y max  at which  r d jx d  jy  is highest and, thus, the
                                             j
                                                 r
           distance of optimal spatial association between centroids of Nabongsoran Andesite porphyry and
           intersections of NNW- and NW-trending faults/fractures.

           centroids of mapped units  of Nabongsoran  Andesite  porphyry and their respective
           nearest neighbour intersection of NNW- and NW-trending faults/fractures. The positive
           spatial association is optimal within  0.7 km of intersections NNW- and NW-trending