
Page 177 - Geochemical Anomaly and Mineral Prospectivity Mapping in GIS
P. 177
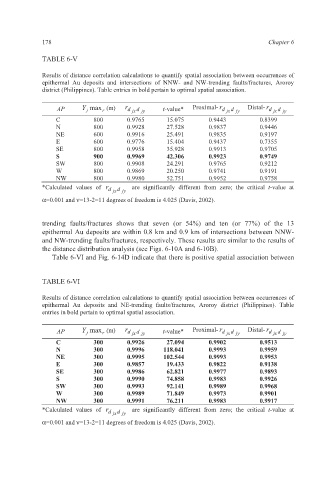
178                                                             Chapter 6

             TABLE 6-V

             Results of distance correlation calculations to quantify spatial association between occurrences of
             epithermal Au deposits and intersections of NNW- and NW-trending faults/fractures, Aroroy
             district (Philippines). Table entries in bold pertain to optimal spatial association.

                 AP     Y max (m)    r d  jx d  jy     t-value*   Proximal- r d  jx d  jy  Distal- r d  jx d  jy
                              r
                          j
                 C          800      0.9765     15.075      0.9443         0.8399
                 N          800      0.9928     27.528      0.9837         0.9446
                 NE         600      0.9916     25.491      0.9835         0.9197
                 E          600      0.9776     15.404      0.9437         0.7355
                 SE         800      0.9958     35.928      0.9913         0.9705
                 S          900      0.9969     42.306      0.9923         0.9749
                 SW         800      0.9908     24.291      0.9765         0.9212
                 W          800      0.9869     20.250      0.9741         0.9191
                 NW         800      0.9980     52.751      0.9952         0.9758
             *Calculated values of  r d  jx d  jy   are significantly different from zero; the critical  t-value at

             α=0.001 and ν=13-2=11 degrees of freedom is 4.025 (Davis, 2002).


             trending faults/fractures shows that seven (or  54%) and ten (or  77%)  of the 13
             epithermal Au deposits are within 0.8 km and 0.9 km of intersections between NNW-
             and NW-trending faults/fractures, respectively. These results are similar to the results of
             the distance distribution analysis (see Figs. 6-10A and 6-10B).
                Table 6-VI and Fig. 6-14D indicate that there is positive spatial association between


             TABLE 6-VI

             Results of distance correlation calculations to quantify spatial association between occurrences of
             epithermal Au deposits and NE-trending faults/fractures, Aroroy district  (Philippines). Table
             entries in bold pertain to optimal spatial association.

                 AP     Y max (m)    r d  jx d  jy     t-value*   Proximal- r d  jx d  jy  Distal- r d  jx d  jy
                              r
                          j
                 C          300      0.9926     27.094      0.9902         0.9513
                 N          300      0.9996    118.041      0.9993         0.9959
                 NE         300      0.9995    102.544      0.9993         0.9953
                 E          300      0.9857     19.433      0.9822         0.9138
                 SE         300      0.9986     62.821      0.9977         0.9893
                 S          300      0.9990     74.858      0.9983         0.9926
                 SW         300      0.9993     92.141      0.9989         0.9968
                 W          300      0.9989     71.849      0.9973         0.9901
                 NW         300      0.9991     76.211      0.9983         0.9917
             *Calculated values of  r d  jx d  jy   are significantly different from zero; the critical  t-value at
             α=0.001 and ν=13-2=11 degrees of freedom is 4.025 (Davis, 2002).