
Page 173 - Geochemical Anomaly and Mineral Prospectivity Mapping in GIS
P. 173
174 Chapter 6
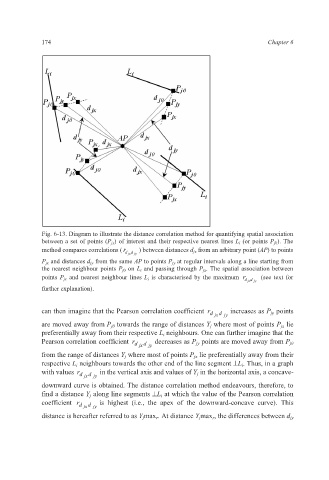
Fig. 6-13. Diagram to illustrate the distance correlation method for quantifying spatial association
between a set of points (P jx ) of interest and their respective nearest lines L i (or points P j0 ). The
method compares correlations ( r ) between distances d jx from an arbitrary point (AP) to points
d jx d jy
P jx and distances d jy from the same AP to points P jy at regular intervals along a line starting from
the nearest neighbour points P j0 on L i and passing through P jx . The spatial association between
points P jx and nearest neighbour lines L i is characterised by the maximum r d jx d jy (see text for
further explanation).
can then imagine that the Pearson correlation coefficient r d jx d jy increases as P jy points
are moved away from P j0 towards the range of distances Y j where most of points P jx lie
preferentially away from their respective L i neighbours. One can further imagine that the
Pearson correlation coefficient r d jx d jy decreases as P jy points are moved away from P j0
from the range of distances Y j where most of points P jx lie preferentially away from their
respective L i neighbours towards the other end of the line segment ⊥L i. Thus, in a graph
with values r d jx d jy in the vertical axis and values of Y j in the horizontal axis, a concave-
downward curve is obtained. The distance correlation method endeavours, therefore, to
find a distance Y j along line segments ⊥L i at which the value of the Pearson correlation
coefficient r d jx d jy is highest (i.e., the apex of the downward-concave curve). This
distance is hereafter referred to as Y jmax r. At distance Y jmax r, the differences between d jy