
Page 169 - Geochemical Anomaly and Mineral Prospectivity Mapping in GIS
P. 169
170 Chapter 6
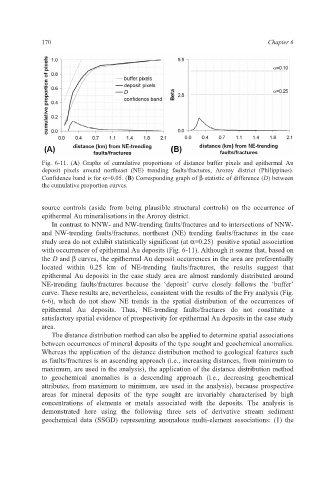
Fig. 6-11. (A) Graphs of cumulative proportions of distance buffer pixels and epithermal Au
deposit pixels around northeast (NE) trending faults/fractures, Aroroy district (Philippines).
Confidence band is for α=0.05. (B) Corresponding graph of β-statistic of difference (D) between
the cumulative proportion curves.
source controls (aside from being plausible structural controls) on the occurrence of
epithermal Au mineralisations in the Aroroy district.
In contrast to NNW- and NW-trending faults/fractures and to intersections of NNW-
and NW-trending faults/fractures, northeast (NE) trending faults/fractures in the case
study area do not exhibit statistically significant (at α=0.25) positive spatial association
with occurrences of epithermal Au deposits (Fig. 6-11). Although it seems that, based on
the D and β curves, the epithermal Au deposit occurrences in the area are preferentially
located within 0.25 km of NE-trending faults/fractures, the results suggest that
epithermal Au deposits in the case study area are almost randomly distributed around
NE-trending faults/fractures because the ‘deposit’ curve closely follows the ‘buffer’
curve. These results are, nevertheless, consistent with the results of the Fry analysis (Fig.
6-6), which do not show NE trends in the spatial distribution of the occurrences of
epithermal Au deposits. Thus, NE-trending faults/fractures do not constitute a
satisfactory spatial evidence of prospectivity for epithermal Au deposits in the case study
area.
The distance distribution method can also be applied to determine spatial associations
between occurrences of mineral deposits of the type sought and geochemical anomalies.
Whereas the application of the distance distribution method to geological features such
as faults/fractures is an ascending approach (i.e., increasing distances, from minimum to
maximum, are used in the analysis), the application of the distance distribution method
to geochemical anomalies is a descending approach (i.e., decreasing geochemical
attributes, from maximum to minimum, are used in the analysis), because prospective
areas for mineral deposits of the type sought are invariably characterised by high
concentrations of elements or metals associated with the deposits. The analysis is
demonstrated here using the following three sets of derivative stream sediment
geochemical data (SSGD) representing anomalous multi-element associations: (1) the