
Page 167 - Geochemical Anomaly and Mineral Prospectivity Mapping in GIS
P. 167
168 Chapter 6
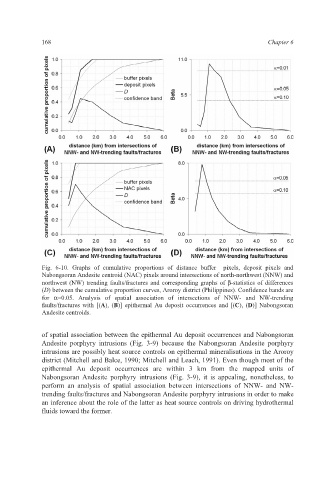
Fig. 6-10. Graphs of cumulative proportions of distance buffer pixels, deposit pixels and
Nabongsoran Andesite centroid (NAC) pixels around intersections of north-northwest (NNW) and
northwest (NW) trending faults/fractures and corresponding graphs of β-statistics of differences
(D) between the cumulative proportion curves, Aroroy district (Philippines). Confidence bands are
for α=0.05. Analysis of spatial association of intersections of NNW- and NW-trending
faults/fractures with [(A), (B)] epithermal Au deposit occurrences and [(C), (D)] Nabongsoran
Andesite centroids.
of spatial association between the epithermal Au deposit occurrences and Nabongsoran
Andesite porphyry intrusions (Fig. 3-9) because the Nabongsoran Andesite porphyry
intrusions are possibly heat source controls on epithermal mineralisations in the Aroroy
district (Mitchell and Balce, 1990; Mitchell and Leach, 1991). Even though most of the
epithermal Au deposit occurrences are within 3 km from the mapped units of
Nabongsoran Andesite porphyry intrusions (Fig. 3-9), it is appealing, nonetheless, to
perform an analysis of spatial association between intersections of NNW- and NW-
trending faults/fractures and Nabongsoran Andesite porphyry intrusions in order to make
an inference about the role of the latter as heat source controls on driving hydrothermal
fluids toward the former.