
Page 166 - Geochemical Anomaly and Mineral Prospectivity Mapping in GIS
P. 166
Analysis of Geologic Controls on Mineral Occurrence 167
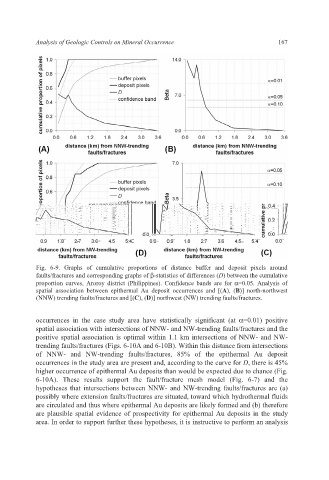
Fig. 6-9. Graphs of cumulative proportions of distance buffer and deposit pixels around
faults/fractures and corresponding graphs of β-statistics of differences (D) between the cumulative
proportion curves, Aroroy district (Philippines). Confidence bands are for α=0.05. Analysis of
spatial association between epithermal Au deposit occurrences and [(A), (B)] north-northwest
(NNW) trending faults/fractures and [(C), (D)] northwest (NW) trending faults/fractures.
occurrences in the case study area have statistically significant (at α=0.01) positive
spatial association with intersections of NNW- and NW-trending faults/fractures and the
positive spatial association is optimal within 1.1 km intersections of NNW- and NW-
trending faults/fractures (Figs. 6-10A and 6-10B). Within this distance from intersections
of NNW- and NW-trending faults/fractures, 85% of the epithermal Au deposit
occurrences in the study area are present and, according to the curve for D, there is 45%
higher occurrence of epithermal Au deposits than would be expected due to chance (Fig.
6-10A). These results support the fault/fracture mesh model (Fig. 6-7) and the
hypotheses that intersections between NNW- and NW-trending faults/fractures are (a)
possibly where extension faults/fractures are situated, toward which hydrothermal fluids
are circulated and thus where epithermal Au deposits are likely formed and (b) therefore
are plausible spatial evidence of prospectivity for epithermal Au deposits in the study
area. In order to support further these hypotheses, it is instructive to perform an analysis