
Page 171 - Geochemical Anomaly and Mineral Prospectivity Mapping in GIS
P. 171
172 Chapter 6
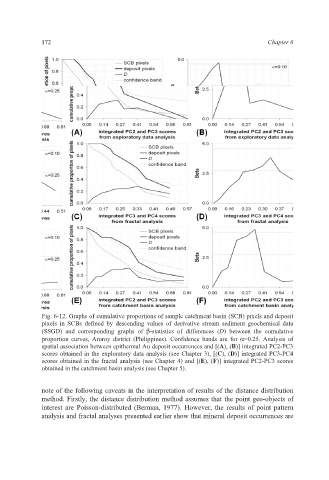
Fig. 6-12. Graphs of cumulative proportions of sample catchment basin (SCB) pixels and deposit
pixels in SCBs defined by descending values of derivative stream sediment geochemical data
(SSGD) and corresponding graphs of β-statistics of differences (D) between the cumulative
proportion curves, Aroroy district (Philippines). Confidence bands are for α=0.25. Analysis of
spatial association between epithermal Au deposit occurrences and [(A), (B)] integrated PC2-PC3
scores obtained in the exploratory data analysis (see Chapter 3), [(C), (D)] integrated PC3-PC4
scores obtained in the fractal analysis (see Chapter 4) and [(E), (F)] integrated PC2-PC3 scores
obtained in the catchment basin analysis (see Chapter 5).
note of the following caveats in the interpretation of results of the distance distribution
method. Firstly, the distance distribution method assumes that the point geo-objects of
interest are Poisson-distributed (Berman, 1977). However, the results of point pattern
analysis and fractal analyses presented earlier show that mineral deposit occurrences are