
Page 176 - Geochemical Anomaly and Mineral Prospectivity Mapping in GIS
P. 176
Analysis of Geologic Controls on Mineral Occurrence 177
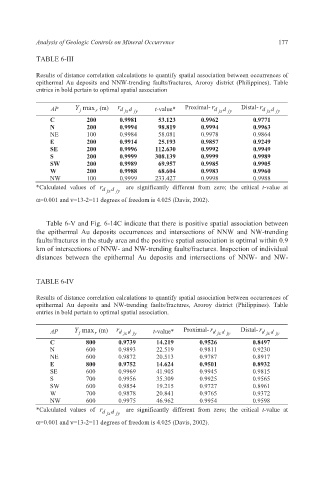
TABLE 6-III
Results of distance correlation calculations to quantify spatial association between occurrences of
epithermal Au deposits and NNW-trending faults/fractures, Aroroy district (Philippines). Table
entries in bold pertain to optimal spatial association
AP Y max (m) r d jx d jy t-value* Proximal- r d jx d jy Distal- r d jx d jy
r
j
C 200 0.9981 53.123 0.9962 0.9771
N 200 0.9994 98.819 0.9994 0.9963
NE 100 0.9984 58.081 0.9978 0.9864
E 200 0.9914 25.193 0.9857 0.9249
SE 200 0.9996 112.630 0.9992 0.9949
S 200 0.9999 308.139 0.9999 0.9989
SW 200 0.9989 69.957 0.9985 0.9905
W 200 0.9988 68.604 0.9983 0.9960
NW 100 0.9999 233.427 0.9998 0.9988
*Calculated values of r d jx d jy are significantly different from zero; the critical t-value at
α=0.001 and ν=13-2=11 degrees of freedom is 4.025 (Davis, 2002).
Table 6-V and Fig. 6-14C indicate that there is positive spatial association between
the epithermal Au deposits occurrences and intersections of NNW and NW-trending
faults/fractures in the study area and the positive spatial association is optimal within 0.9
km of intersections of NNW- and NW-trending faults/fractures. Inspection of individual
distances between the epithermal Au deposits and intersections of NNW- and NW-
TABLE 6-IV
Results of distance correlation calculations to quantify spatial association between occurrences of
epithermal Au deposits and NW-trending faults/fractures, Aroroy district (Philippines). Table
entries in bold pertain to optimal spatial association.
AP Y max (m) r d jx d jy t-value* Proximal- r d jx d jy Distal- r d jx d jy
j
r
C 800 0.9739 14.219 0.9526 0.8497
N 600 0.9893 22.519 0.9811 0.9230
NE 600 0.9872 20.513 0.9787 0.8917
E 800 0.9752 14.624 0.9501 0.8932
SE 600 0.9969 41.905 0.9945 0.9815
S 700 0.9956 35.309 0.9925 0.9565
SW 600 0.9854 19.215 0.9727 0.8961
W 700 0.9878 20.841 0.9765 0.9372
NW 600 0.9975 46.962 0.9954 0.9598
*Calculated values of r d jx d jy are significantly different from zero; the critical t-value at
α=0.001 and ν=13-2=11 degrees of freedom is 4.025 (Davis, 2002).