
Page 181 - Geochemical Anomaly and Mineral Prospectivity Mapping in GIS
P. 181
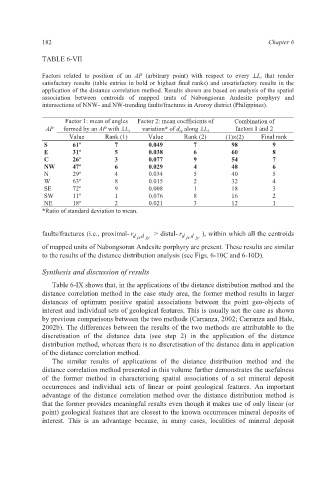
182                                                             Chapter 6

             TABLE 6-VII

             Factors related  to position of  an  AP (arbitrary point) with respect  to every  ⊥L i  that  render
             satisfactory results (table entries in bold or highest final ranks) and unsatisfactory results in the
             application of the distance correlation method. Results shown are based on analysis of the spatial
             association between centroids of mapped units of Nabongsoran Andesite porphyry  and
             intersections of NNW- and NW-trending faults/fractures in Aroroy district (Philippines).

                    Factor 1: mean of angles   Factor 2: mean coefficients of   Combination of
              AP   formed by an AP with ⊥L i    variation* of d jy  along ⊥L i    factors 1 and 2
                     Value     Rank (1)    Value     Rank (2)    (1)×(2)   Final rank
              S       61º         7        0.049        7          98         9
              E       31º         5        0.038        6          60         8
              C       26º         3        0.077        9          54         7
              NW      47º         6        0.029        4          48         6
              N       29º         4        0.034        5          40         5
              W       63º         8        0.015        2          32         4
              SE      72º         9        0.008        1          18         3
              SW      11º         1        0.076        8          16         2
              NE      18º         2        0.021        3          12         1
             *Ratio of standard deviation to mean.


             faults/fractures (i.e., proximal- r d jx d  jy   > distal- r d  jx d  jy  ), within which all the centroids
             of mapped units of Nabongsoran Andesite porphyry are present. These results are similar
             to the results of the distance distribution analysis (see Figs. 6-10C and 6-10D).

             Synthesis and discussion of results

                Table 6-IX shows that, in the applications of the distance distribution method and the
             distance correlation method in the case study area, the former method results in larger
             distances of  optimum positive spatial associations between the  point geo-objects of
             interest and individual sets of geological features. This is usually not the case as shown
             by previous comparisons between the two methods (Carranza, 2002; Carranza and Hale,
             2002b). The differences between the results of the two methods are attributable to the
             discretisation  of the distance data (see step 2) in the application of the distance
             distribution method, whereas there is no discretisation of the distance data in application
             of the distance correlation method.
                The similar results of applications of the distance distribution method and the
             distance correlation method presented in this volume further demonstrates the usefulness
             of the former  method in characterising spatial associations of a set mineral deposit
             occurrences and individual  sets of linear  or  point  geological features. An important
             advantage  of the  distance correlation method over the  distance  distribution method is
             that the former provides meaningful results even though it makes use of only linear (or
             point) geological features that are closest to the known occurrences mineral deposits of
             interest. This  is an advantage because, in  many cases,  localities of mineral deposit