
Page 178 - Geochemical Anomaly and Mineral Prospectivity Mapping in GIS
P. 178
Analysis of Geologic Controls on Mineral Occurrence 179
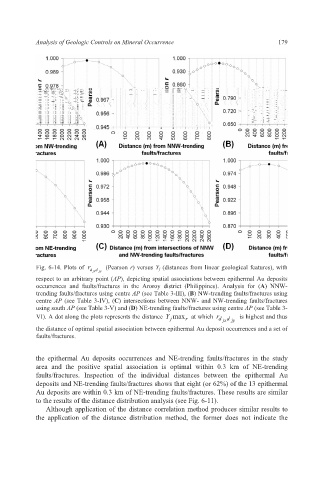
Fig. 6-14. Plots of r d jx d jy (Pearson r) versus Y j (distances from linear geological features), with
respect to an arbitrary point (AP), depicting spatial associations between epithermal Au deposits
occurrences and faults/fractures in the Aroroy district (Philippines). Analysis for (A) NNW-
trending faults/fractures using centre AP (see Table 3-III), (B) NW-trending faults/fractures using
centre AP (see Table 3-IV), (C) intersections between NNW- and NW-trending faults/fractures
using south AP (see Table 3-V) and (D) NE-trending faults/fractures using centre AP (see Table 3-
VI). A dot along the plots represents the distance Y max at which r d jx d jy is highest and thus
r
j
the distance of optimal spatial association between epithermal Au deposit occurrences and a set of
faults/fractures.
the epithermal Au deposits occurrences and NE-trending faults/fractures in the study
area and the positive spatial association is optimal within 0.3 km of NE-trending
faults/fractures. Inspection of the individual distances between the epithermal Au
deposits and NE-trending faults/fractures shows that eight (or 62%) of the 13 epithermal
Au deposits are within 0.3 km of NE-trending faults/fractures. These results are similar
to the results of the distance distribution analysis (see Fig. 6-11).
Although application of the distance correlation method produces similar results to
the application of the distance distribution method, the former does not indicate the