
Page 163 - Geochemical Anomaly and Mineral Prospectivity Mapping in GIS
P. 163
164 Chapter 6
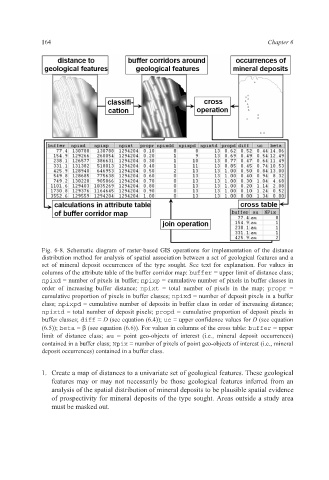
Fig. 6-8. Schematic diagram of raster-based GIS operations for implementation of the distance
distribution method for analysis of spatial association between a set of geological features and a
set of mineral deposit occurrences of the type sought. See text for explanation. For values in
columns of the attribute table of the buffer corridor map: buffer = upper limit of distance class;
npixd = number of pixels in buffer; npixp = cumulative number of pixels in buffer classes in
order of increasing buffer distance; npixt = total number of pixels in the map; propr =
cumulative proportion of pixels in buffer classes; npixd = number of deposit pixels in a buffer
class; npixpd = cumulative number of deposits in buffer class in order of increasing distance;
npixtd = total number of deposit pixels; propd = cumulative proportion of deposit pixels in
buffer classes; diff = D (see equation (6.4)); uc = upper confidence values for D (see equation
(6.5)); beta = β (see equation (6.6)). For values in columns of the cross table: buffer = upper
limit of distance class; au = point geo-objects of interest (i.e., mineral deposit occurrences)
contained in a buffer class; Npix = number of pixels of point geo-objects of interest (i.e., mineral
deposit occurrences) contained in a buffer class.
1. Create a map of distances to a univariate set of geological features. These geological
features may or may not necessarily be those geological features inferred from an
analysis of the spatial distribution of mineral deposits to be plausible spatial evidence
of prospectivity for mineral deposits of the type sought. Areas outside a study area
must be masked out.