
Page 213 - Geochemical Anomaly and Mineral Prospectivity Mapping in GIS
P. 213
Knowledge-Driven Modeling of Mineral Prospectivity 215
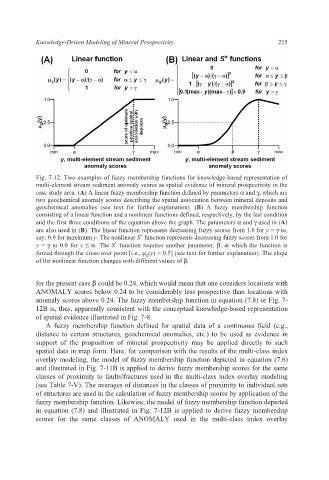
Fig. 7-12. Two examples of fuzzy membership functions for knowledge-based representation of
multi-element stream sediment anomaly scores as spatial evidence of mineral prospectivity in the
case study area. (A) A linear fuzzy membership function defined by parameters α and γ, which are
two geochemical anomaly scores describing the spatial association between mineral deposits and
geochemical anomalies (see text for further explanation). (B) A fuzzy membership function
consisting of a linear function and a nonlinear functions defined, respectively, by the last condition
and the first three conditions of the equation above the graph. The parameters α and γ used in (A)
are also used in (B). The linear function represents decreasing fuzzy scores from 1.0 for y = γ to,
+
say, 0.9 for maximum y. The nonlinear S function represents decreasing fuzzy scores from 1.0 for
+
y = γ to 0.0 for y ≤ α. The S function requires another parameter, β, at which the function is
forced through the cross-over point [i.e., μ g (y) = 0.5] (see text for further explanation). The slope
of the nonlinear function changes with different values of β.
for the present case β could be 0.24, which would mean that one considers locations with
ANOMALY scores below 0.24 to be considerably less prospective than locations with
anomaly scores above 0.24. The fuzzy membership function in equation (7.8) or Fig. 7-
12B is, thus, apparently consistent with the conceptual knowledge-based representation
of spatial evidence illustrated in Fig. 7-8.
A fuzzy membership function defined for spatial data of a continuous field (e.g.,
distance to certain structures, geochemical anomalies, etc.) to be used as evidence in
support of the proposition of mineral prospectivity may be applied directly to such
spatial data in map form. Here, for comparison with the results of the multi-class index
overlay modeling, the model of fuzzy membership function depicted in equation (7.6)
and illustrated in Fig. 7-11B is applied to derive fuzzy membership scores for the same
classes of proximity to faults/fractures used in the multi-class index overlay modeling
(see Table 7-V). The averages of distances in the classes of proximity to individual sets
of structures are used in the calculation of fuzzy membership scores by application of the
fuzzy membership function. Likewise, the model of fuzzy membership function depicted
in equation (7.8) and illustrated in Fig. 7-12B is applied to derive fuzzy membership
scores for the same classes of ANOMALY used in the multi-class index overlay