
Page 214 - Geochemical Anomaly and Mineral Prospectivity Mapping in GIS
P. 214
216 Chapter 7
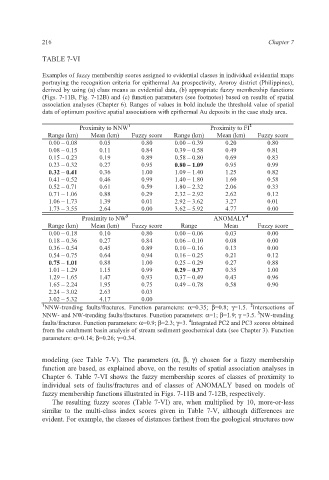
TABLE 7-VI
Examples of fuzzy membership scores assigned to evidential classes in individual evidential maps
portraying the recognition criteria for epithermal Au prospectivity, Aroroy district (Philippines),
derived by using (a) class means as evidential data, (b) appropriate fuzzy membership functions
(Figs. 7-11B, Fig. 7-12B) and (c) function parameters (see footnotes) based on results of spatial
association analyses (Chapter 6). Ranges of values in bold include the threshold value of spatial
data of optimum positive spatial associations with epithermal Au deposits in the case study area.
2
Proximity to NNW 1 Proximity to FI
Range (km) Mean (km) Fuzzy score Range (km) Mean (km) Fuzzy score
0.00 – 0.08 0.05 0.80 0.00 – 0.39 0.20 0.80
0.08 – 0.15 0.11 0.84 0.39 – 0.58 0.49 0.81
0.15 – 0.23 0.19 0.89 0.58 – 0.80 0.69 0.83
0.23 – 0.32 0.27 0.95 0.80 – 1.09 0.95 0.99
0.32 – 0.41 0.36 1.00 1.09 – 1.40 1.25 0.82
0.41 – 0.52 0.46 0.99 1.40 – 1.80 1.60 0.58
0.52 – 0.71 0.61 0.59 1.80 – 2.32 2.06 0.33
0.71 – 1.06 0.88 0.29 2.32 – 2.92 2.62 0.12
1.06 – 1.73 1.39 0.01 2.92 – 3.62 3.27 0.01
1.73 – 3.55 2.64 0.00 3.62 – 5.92 4.77 0.00
4
Proximity to NW 3 ANOMALY
Range (km) Mean (km) Fuzzy score Range Mean Fuzzy score
0.00 – 0.18 0.10 0.80 0.00 – 0.06 0.03 0.00
0.18 – 0.36 0.27 0.84 0.06 – 0.10 0.08 0.00
0.36 – 0.54 0.45 0.89 0.10 – 0.16 0.13 0.00
0.54 – 0.75 0.64 0.94 0.16 – 0.25 0.21 0.12
0.75 – 1.01 0.88 1.00 0.25 – 0.29 0.27 0.88
1.01 – 1.29 1.15 0.99 0.29 – 0.37 0.35 1.00
1.29 – 1.65 1.47 0.93 0.37 – 0.49 0.43 0.96
1.65 – 2.24 1.95 0.75 0.49 – 0.78 0.58 0.90
2.24 – 3.02 2.63 0.03
3.02 – 5.32 4.17 0.00
1 NNW-trending faults/fractures. Function parameters: α=0.35; β=0.8; γ=1.5. Intersections of
2
3
NNW- and NW-trending faults/fractures. Function parameters: α=1; β=1.9; γ =3.5. NW-trending
4
faults/fractures. Function parameters: α=0.9; β=2.3; γ=3. Integrated PC2 and PC3 scores obtained
from the catchment basin analysis of stream sediment geochemical data (see Chapter 3). Function
parameters: α=0.14; β=0.26; γ=0.34.
modeling (see Table 7-V). The parameters (α, β, γ) chosen for a fuzzy membership
function are based, as explained above, on the results of spatial association analyses in
Chapter 6. Table 7-VI shows the fuzzy membership scores of classes of proximity to
individual sets of faults/fractures and of classes of ANOMALY based on models of
fuzzy membership functions illustrated in Figs. 7-11B and 7-12B, respectively.
The resulting fuzzy scores (Table 7-VI) are, when multiplied by 10, more-or-less
similar to the multi-class index scores given in Table 7-V, although differences are
evident. For example, the classes of distances farthest from the geological structures now